
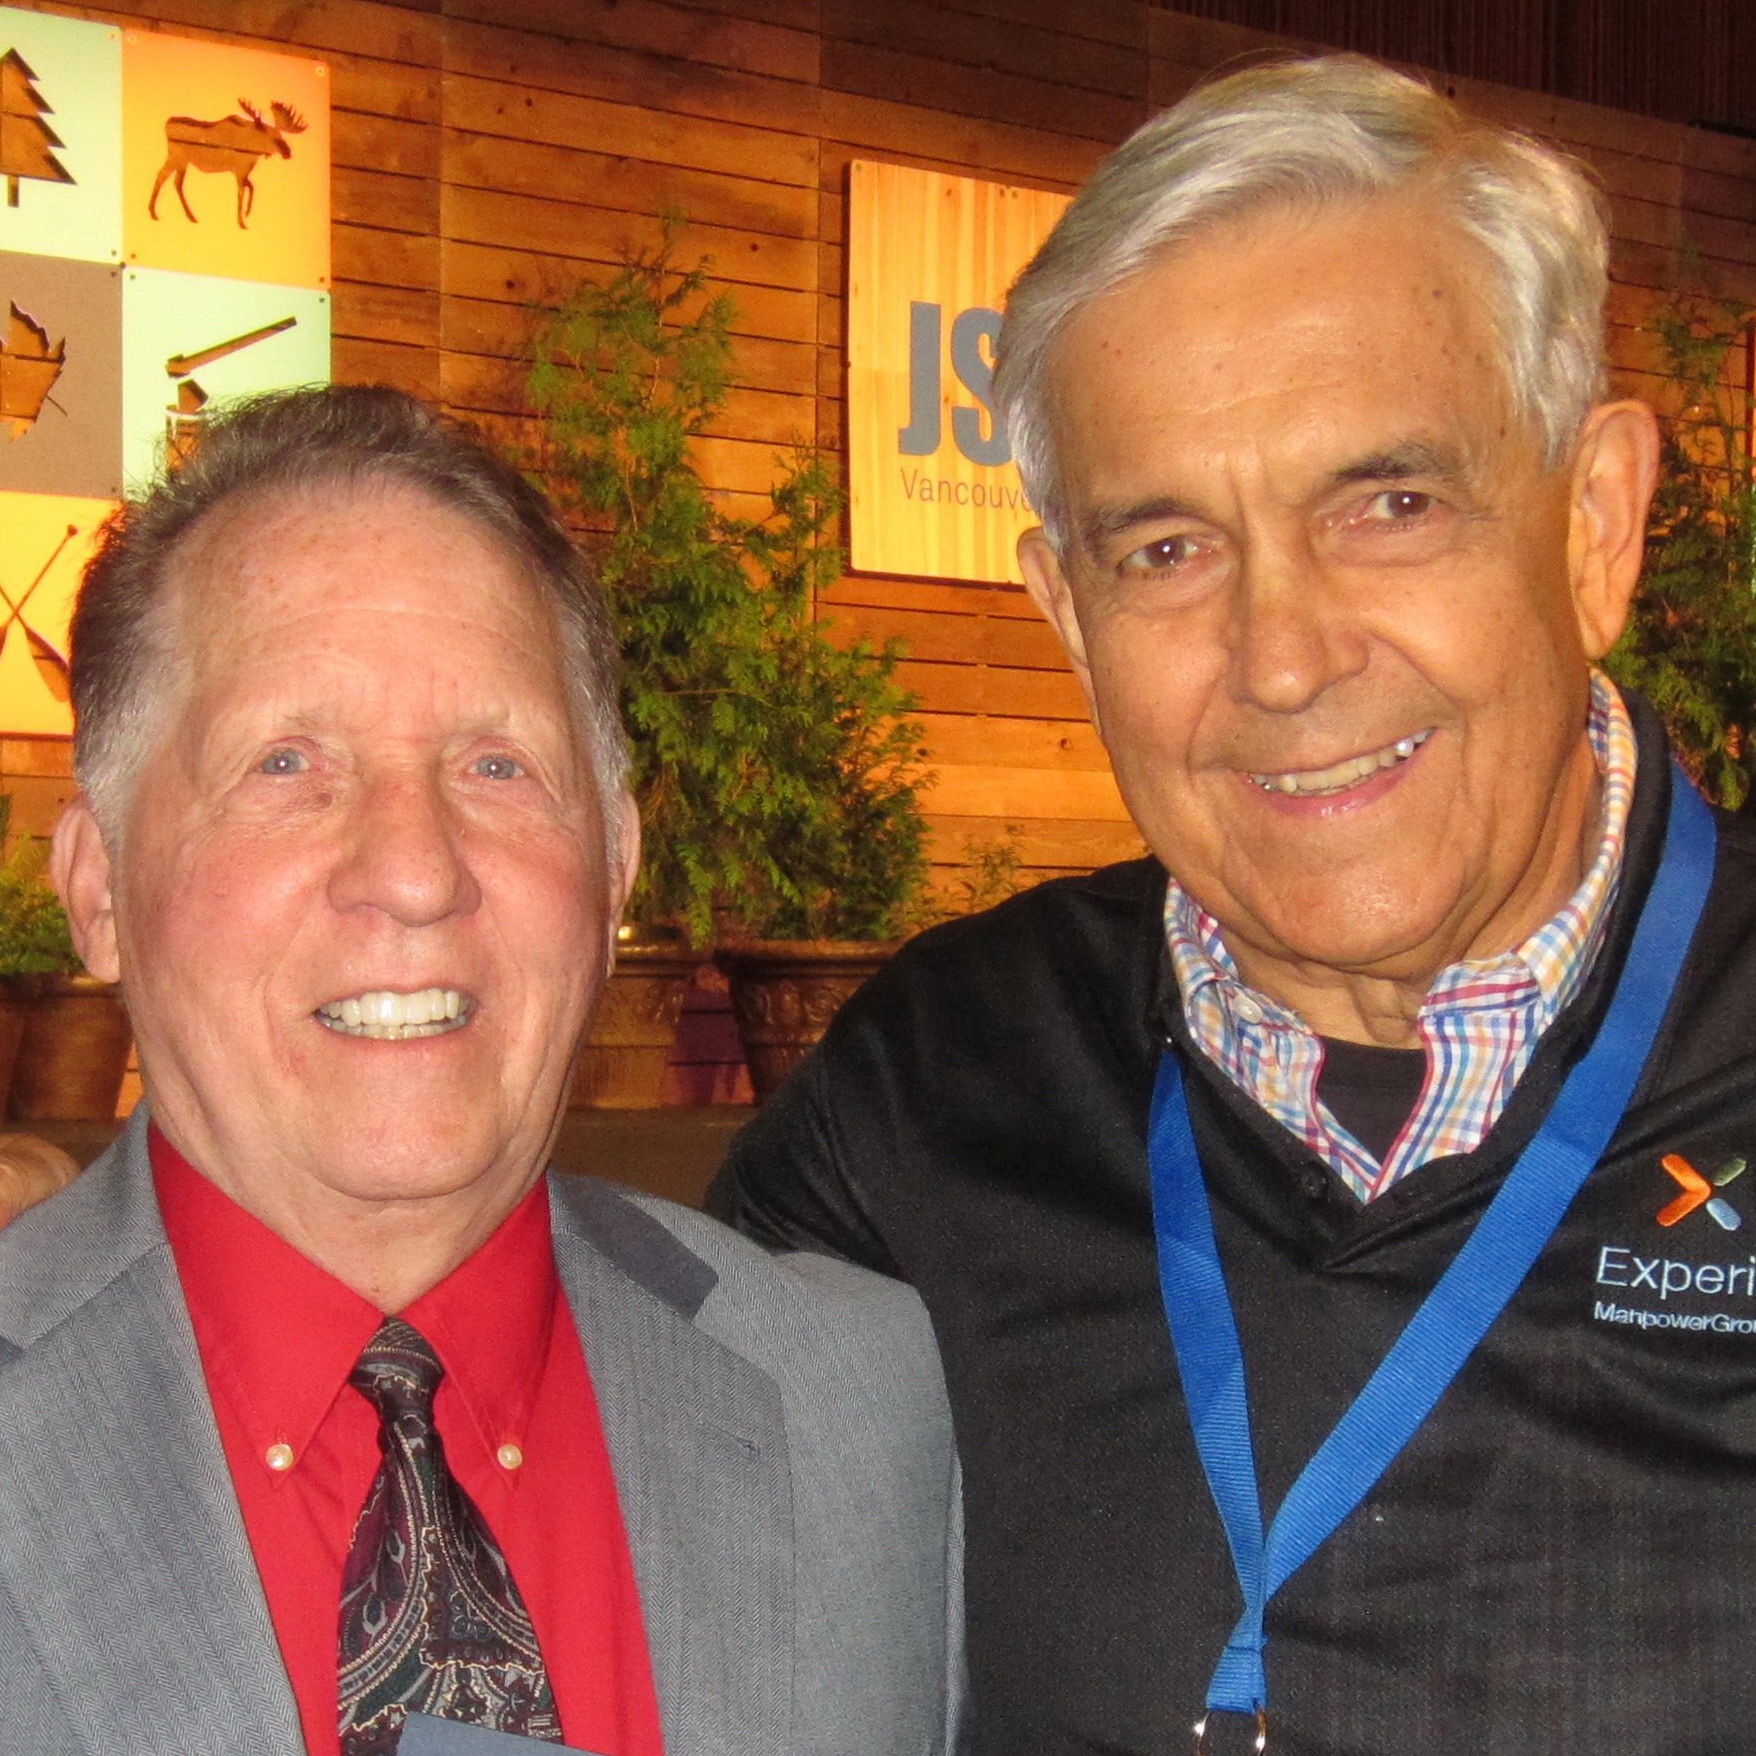
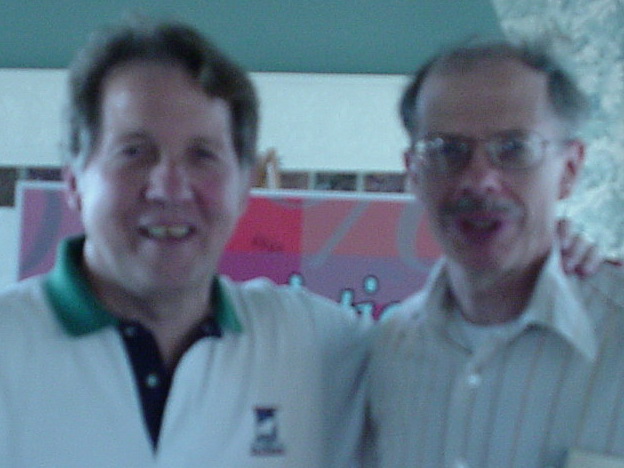
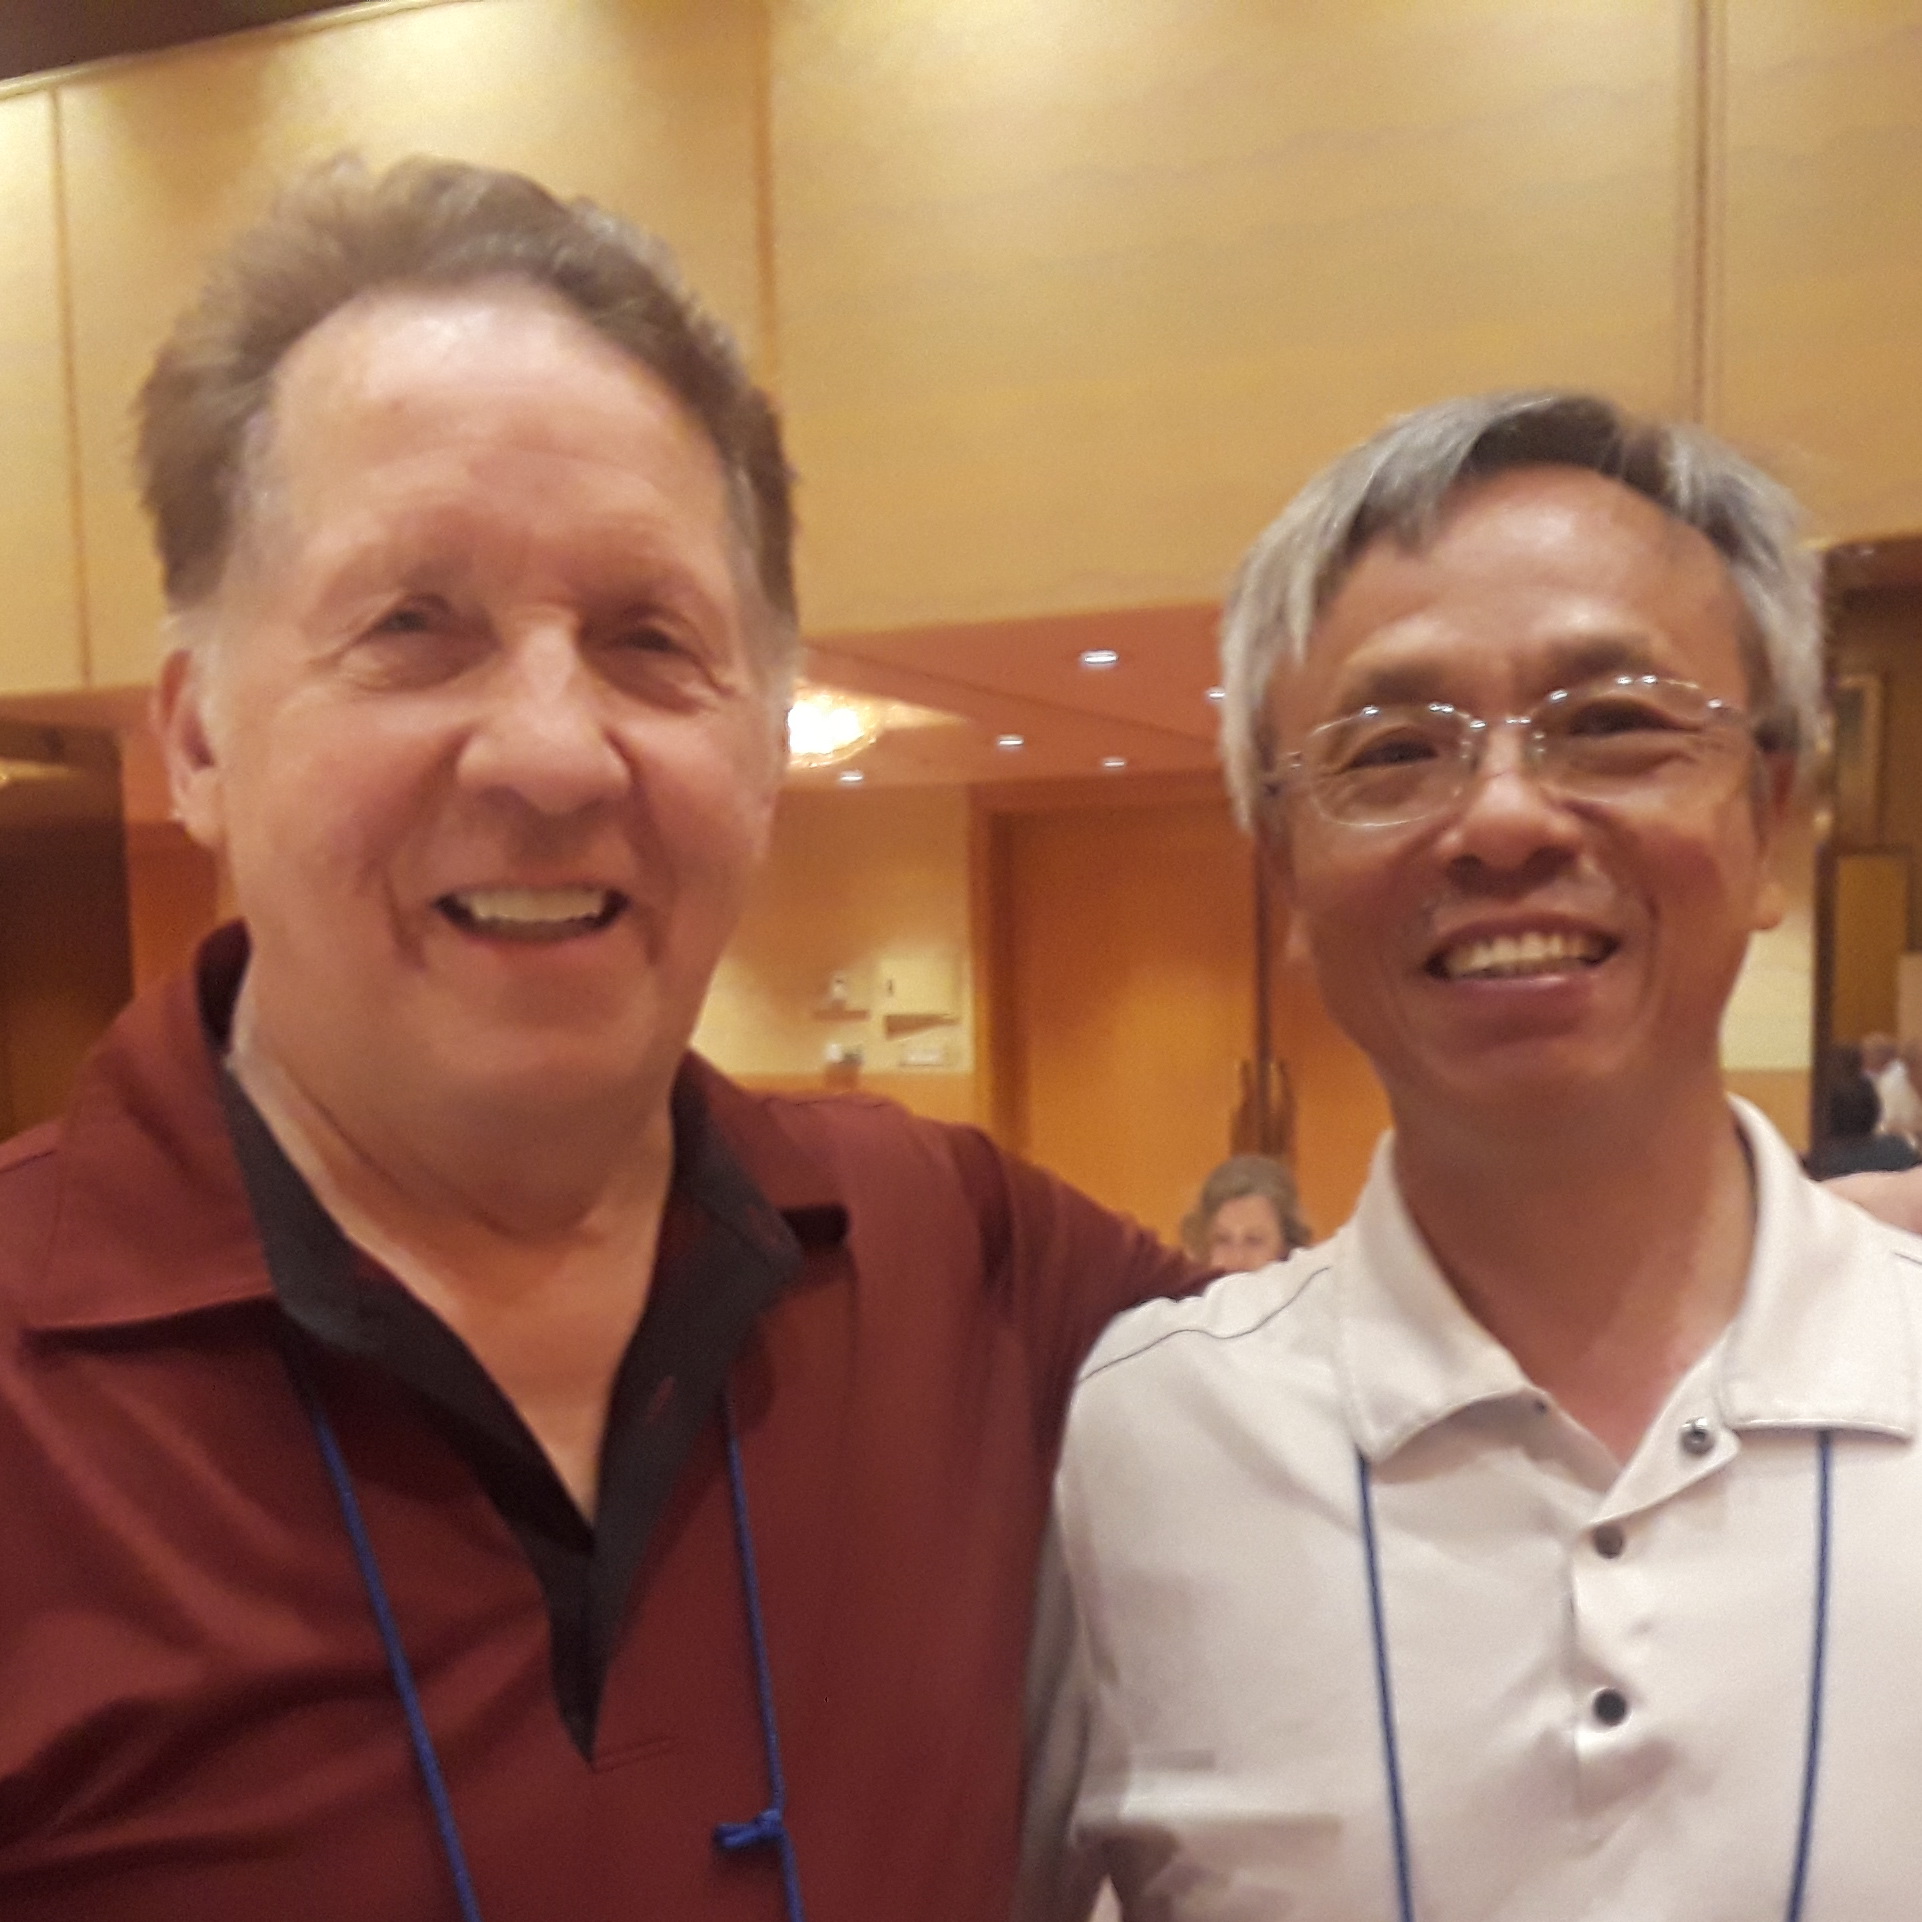
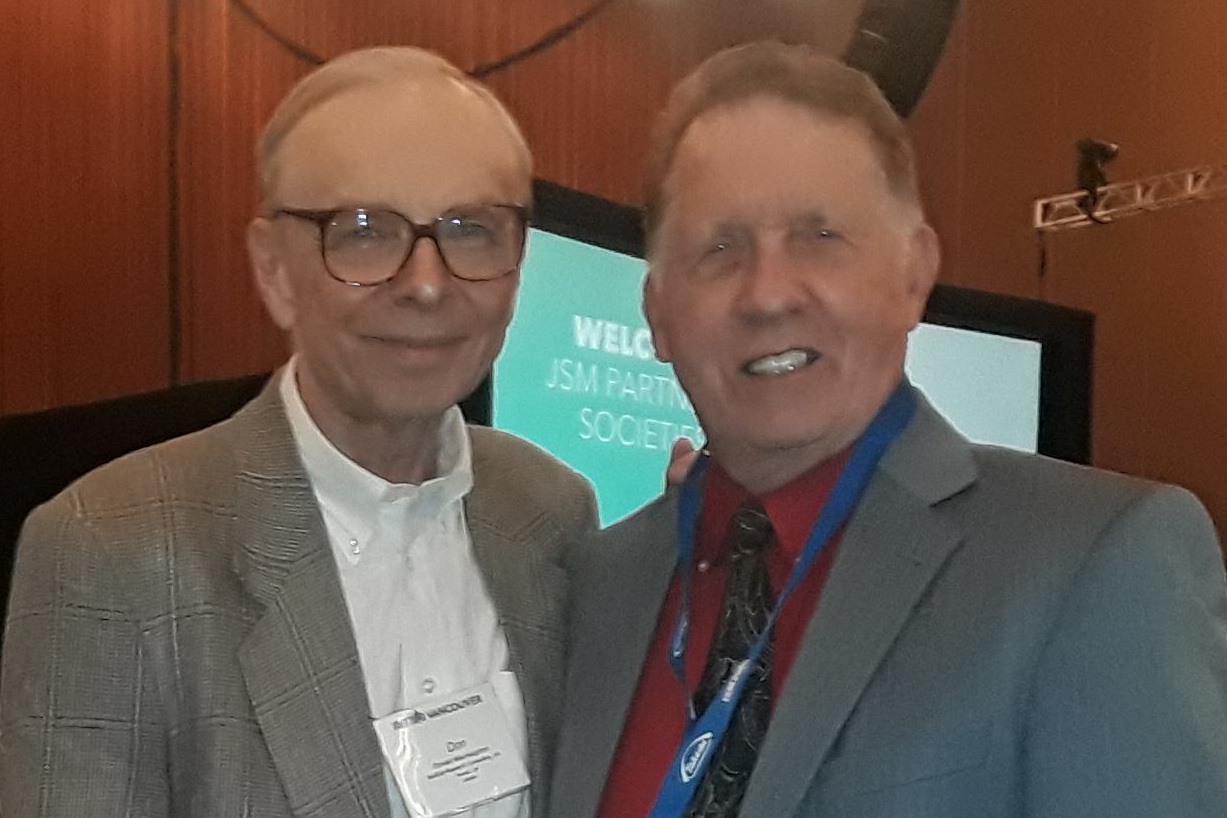
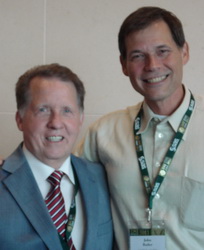
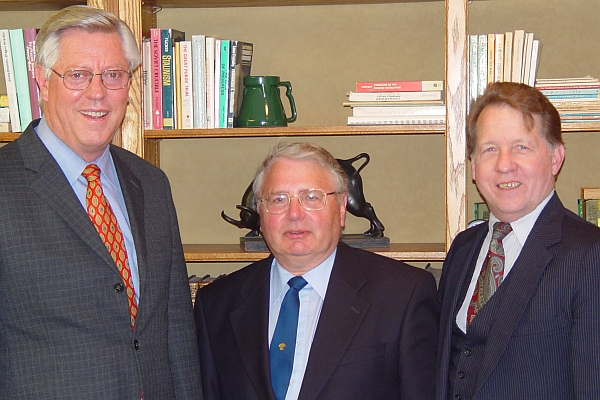
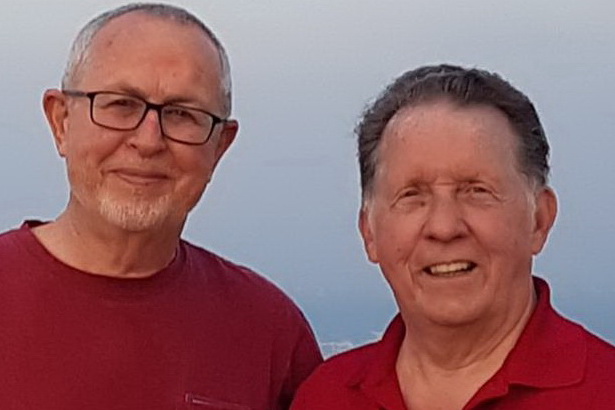
Above — Milo Schield (PhD Rice) and Doug Zahn (PhD Harvard): both ASA Fellows; both graduates of Waverly High School (Iowa).
2025 Dec: Milo Schield's Statistical Literacy Achievements (CV)
Milo Schield Biography (Short)
As of 2020, Dr. Milo Schield is:
- Author of the Statistical Literacy textbook.
- Professor Emeritus of Business Administration at Augsburg College. Augsburg Home page 1 Home page 2 Statistical Literacy at Augsburg (2016)
- Fellow of the American Statistical Association
- Elected member of the International Statistical Institute (ISI 2011)
- US Representative of the International Statistical Literacy Project (ISLP)
- Statistical Literacy Coordinator for the Mathematics-Statistics Department, University of New Mexico, Albuquerque
- Editor of StatLit.org
- Past-President of the National Numeracy Network (NNN)
- Past-President of the Twin Cities Chapter of the American Statistical Association (ASA)
- Past-Director of the W. M. Keck Statistical Literacy Project (2001-2005)
Schield papers chronologically CV Intros (2016, 2012) International Talks by Location JSM Sessions
- 2018:
- Schield ASA Fellow: Notification Nomination CV Citations 2/2018 Letters: Bailer, Kaplan, Weisberg, Wild & Witmer
- 2017:
- Schield Citations 11/2017 Classify Statements: Survey Schield Claims KEY490F Student Survey Results
- 2016:
- SERJ 2016 Augsburg News Research Gate Citations 3/2016 Research-Gate Summary 6/2016
- 2015:
- Wiley Textbook proposal: Practical Statistics for Professionals RSS Proposal.
- 2015:
- NNN Candidate for Vice President ASA Section on Statistical Education Board Member (at large) CV
- 2015:
- USCOTS Lifetime Achievement award. Nomination letter Complete packet
- 2015:
- Judea Pearl Causality Prize. Nomination packet.
- 2015:
- USCOTS Schield AIDS video Statisticians make life better 960x720 (3.5mb). Text Slides: 6up 1up
2001: W. M. Keck Statistical Literacy Grant to Augsburg College (2001–2005):
Goal: “To Develop Statistical Literacy as an Interdisciplinary Curriculum in the Liberal Arts”
Principal Investigator: Milo Schield
W. M. Keck Foundation Goals poster (2002)
Statistical Literacy Header (2001)
- Initial Proposal ($1.2M) Revised Proposal (Jan. 2001, $500k) Appendix
- Onsite visit (May 2001): Expand StatEd to Include “Observational Causation” 6up; Generate teaching materials 6up; Expand Stat Ed to Include Statistical Literacy 6up; Together we can make a difference 6up Schedule (draft)
- W. M. Keck Foundation Grant to Augsburg
- Celebration pictures (July 2001): Knight, Dalglish, Schwain, Stoller, Reichenbach and Currey.
Other Materials:
- 2A. The W. M. Keck Statistical Literacy Course at Augsburg: An Overview
- Comments by Hulsizer and Woolf (2009) on page 63 in A Guide to Teaching Statistics: Innovations and Best Practices.
-
Milo Schield (2005), Director of the W. M. Keck Statistical Literacy
Project, argued that instructors have the responsibility to not only teach
basic statistical competence, but to become “evangelists” for statistical
literacy. He argued that we should develop introductory statistics
courses that attract students because students find the material enjoyable
and beneficial. To foster statistical literacy, teachers and students
must discuss and argue every day, real-world examples of statistics from the
media, news, and journal studies. As a results, the ultimate course
evaluation should consist of measuring students' “appreciation for the value
of statistics in everyday life” (p 4.)
Schield, M (2005). Statistical Literacy: An Evangelical Calling for Statistical Educators, 2005 ISI. See StatLit.org/pdf/2005SchieldISI.pdf - 2006 Augsburg NOW: Business Department is International
In the News:
- Schield proposal for his Wikipedia page.
- Schield proposal for Chronicle of Higher Education: People to Watch
- 2026 Mu Sigma Rho award to Milo Schield
- LA Times (2010 Jan 31): “But Who's Counting”
Posters:
- Schield and Kaplan (2011): Modelling in Context: Teaching Confounding and Adjustment through Common Core Standards. USCOTS
- Schield and Copes (2011): Odysseys: Teach Critical Thinking. Augsburg
- Isaacson (2011): Where do Statistics Come From? USCOTS
- Schield and Brick (2009): Slightly Radical Ideas to Help Students Interpret Introductory Statistics. USCOTS. Also
- Schield (2006): Statistical Literacy is to Statistics as Art Appreciation is to Art. ICOTS-5.
- Schield (2001): Statistical Literacy Creed
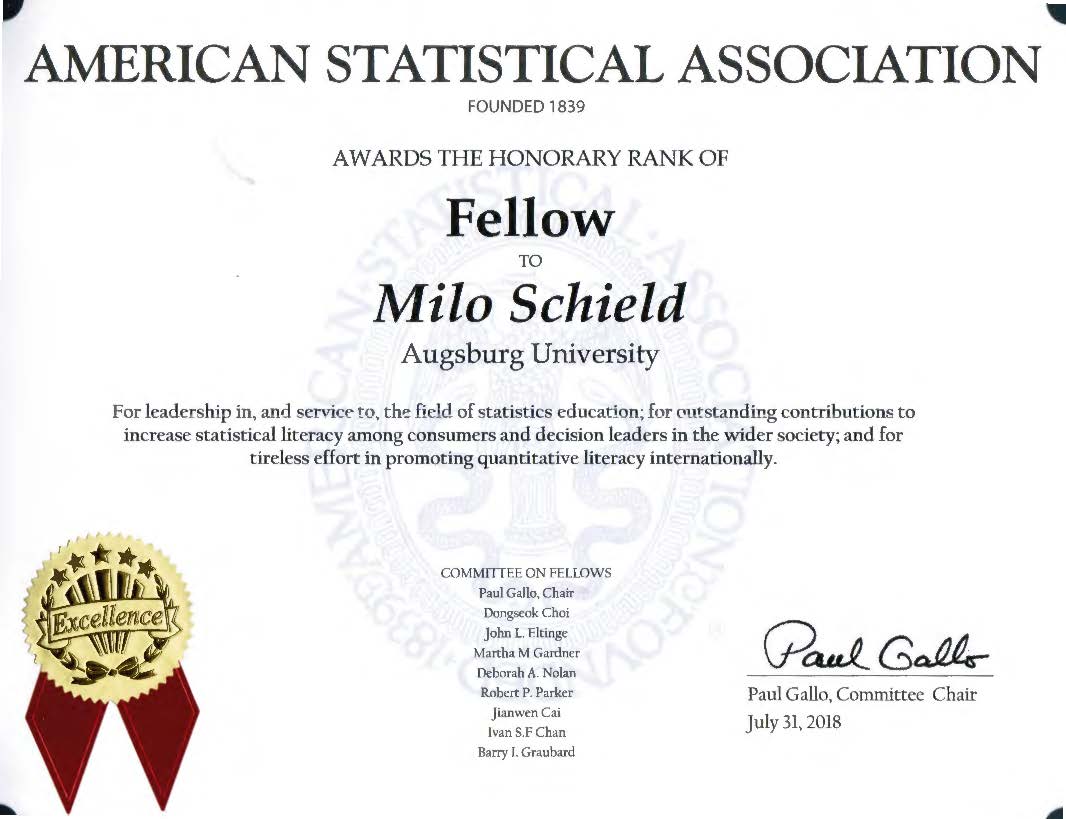
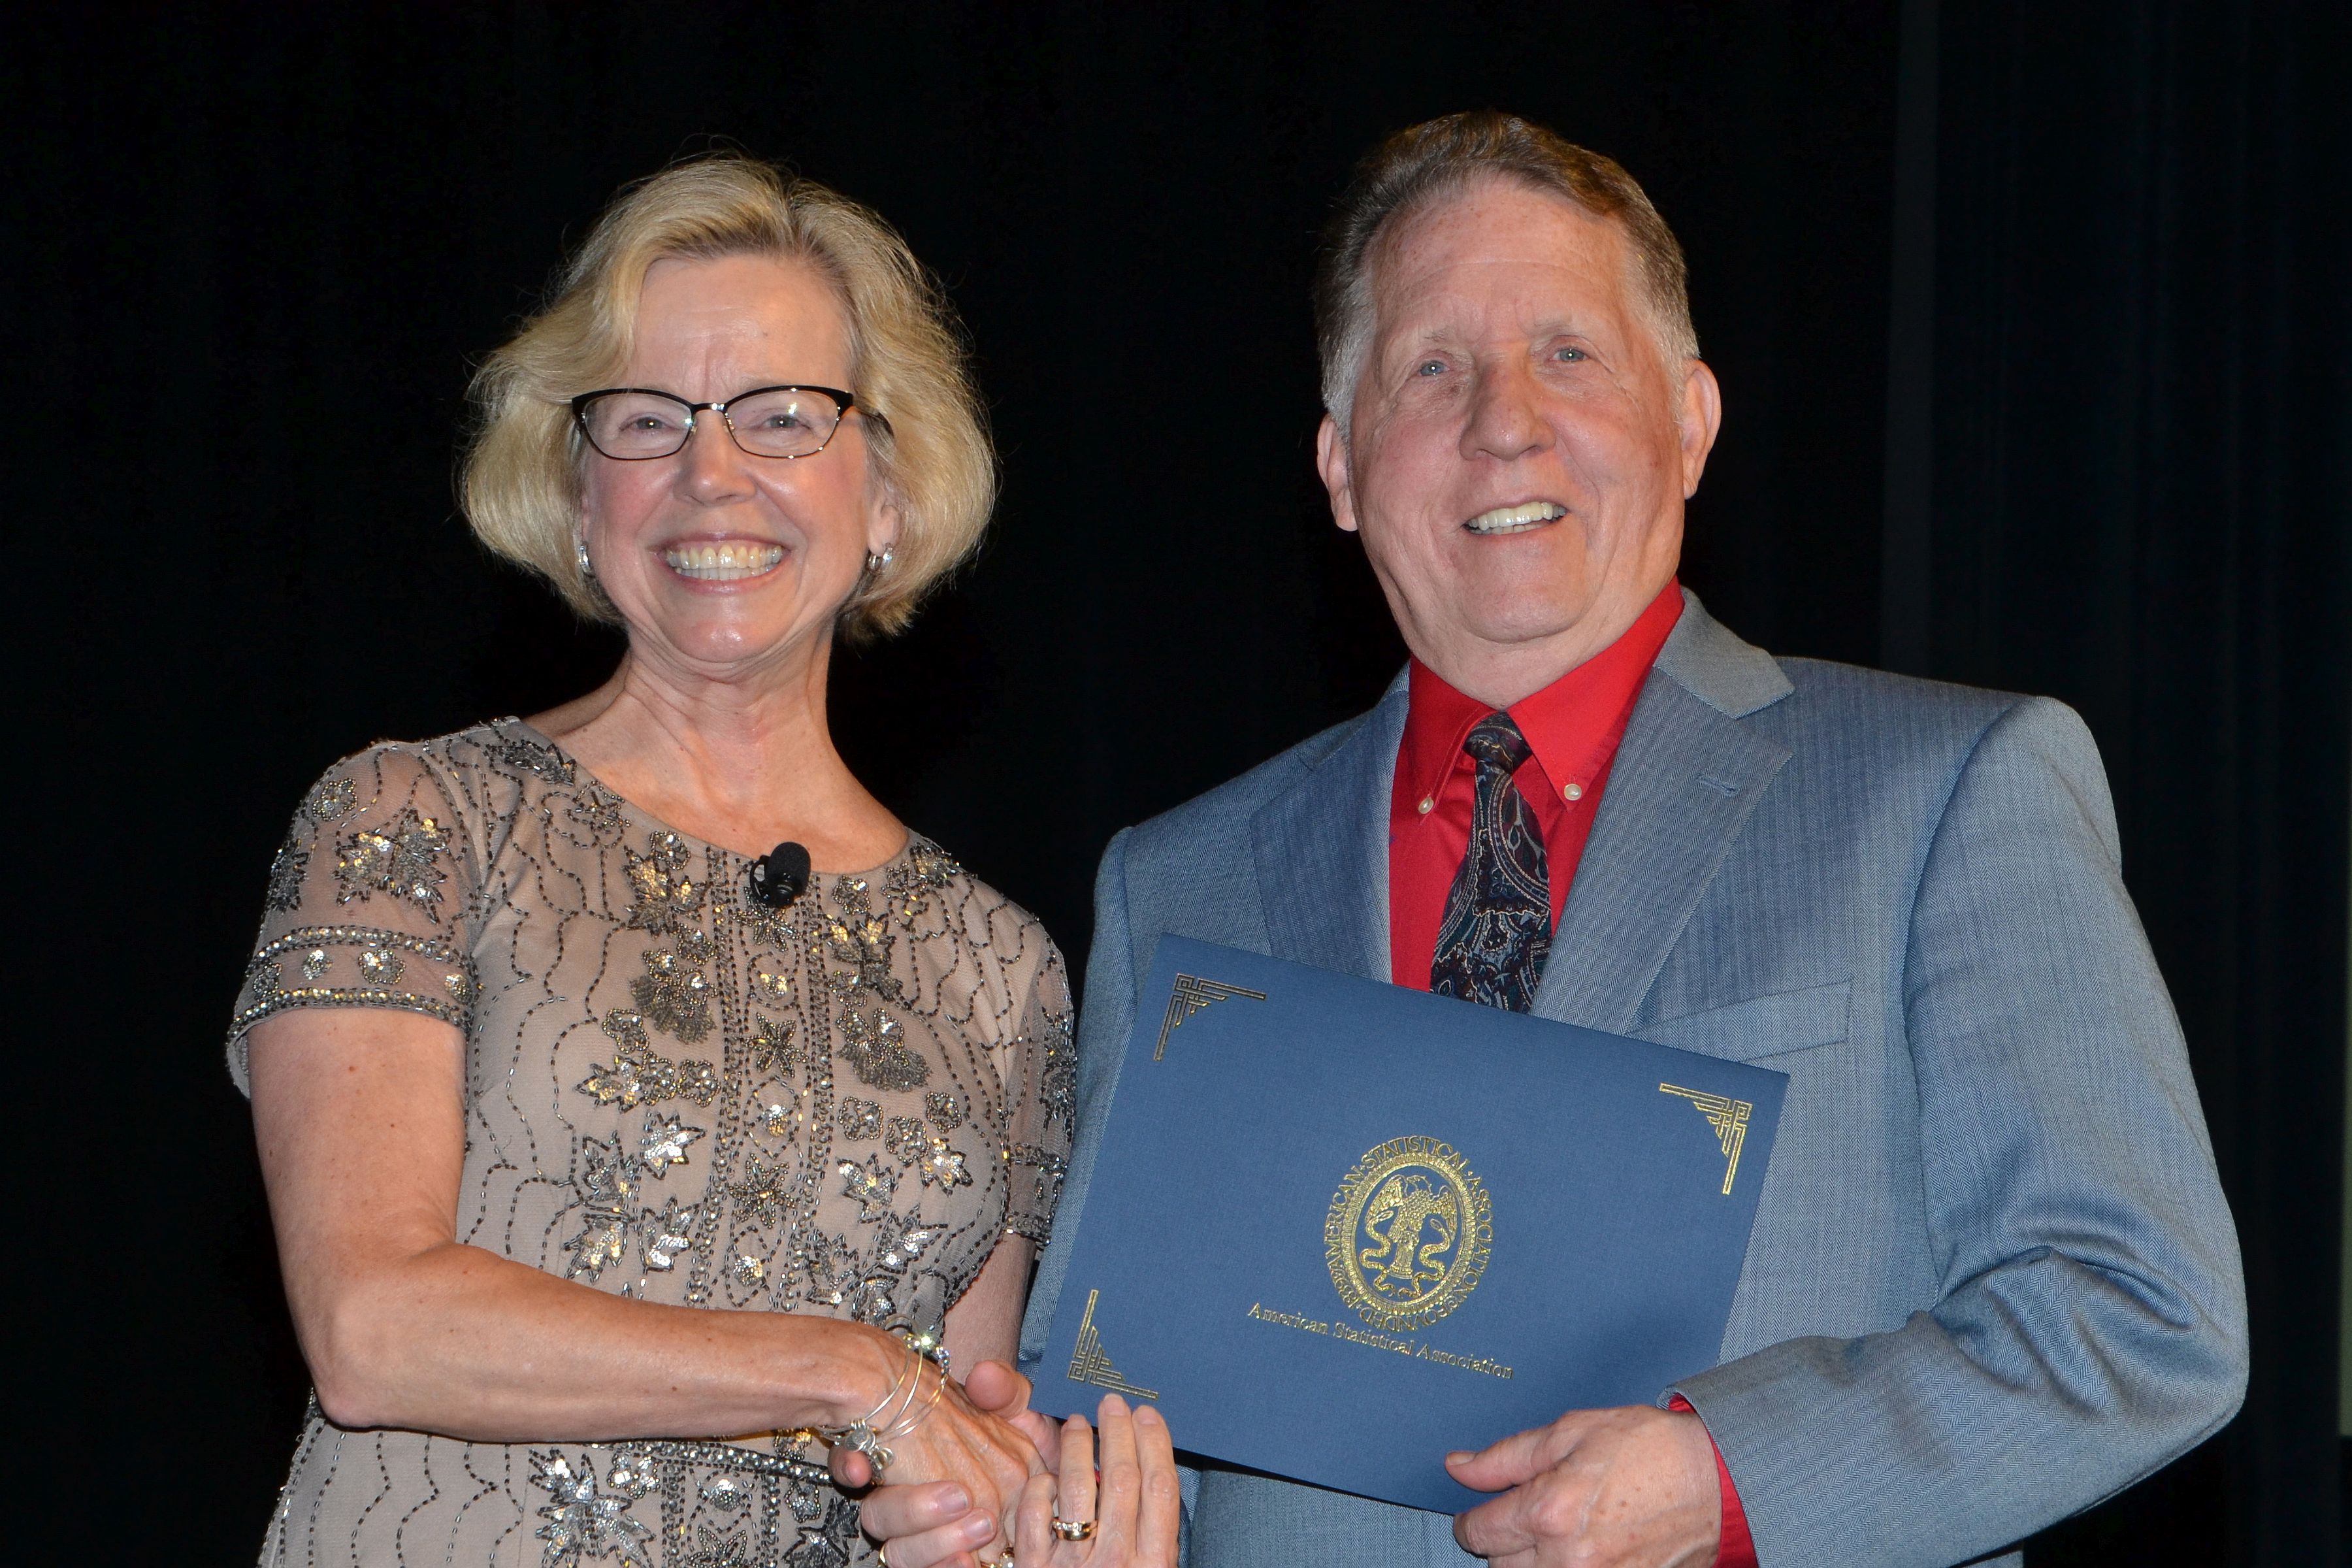
2018: Milo Schield selected as a Fellow by the American Statistical Association:
At the Joint Statistical Meeting in Vancouver, Dr. Milo Schield was
selected to be a Fellow
by the American Statistical Association. This high honor is limited to 0.3%
of the membership each year (roughly 60 out of 18,000). The citation
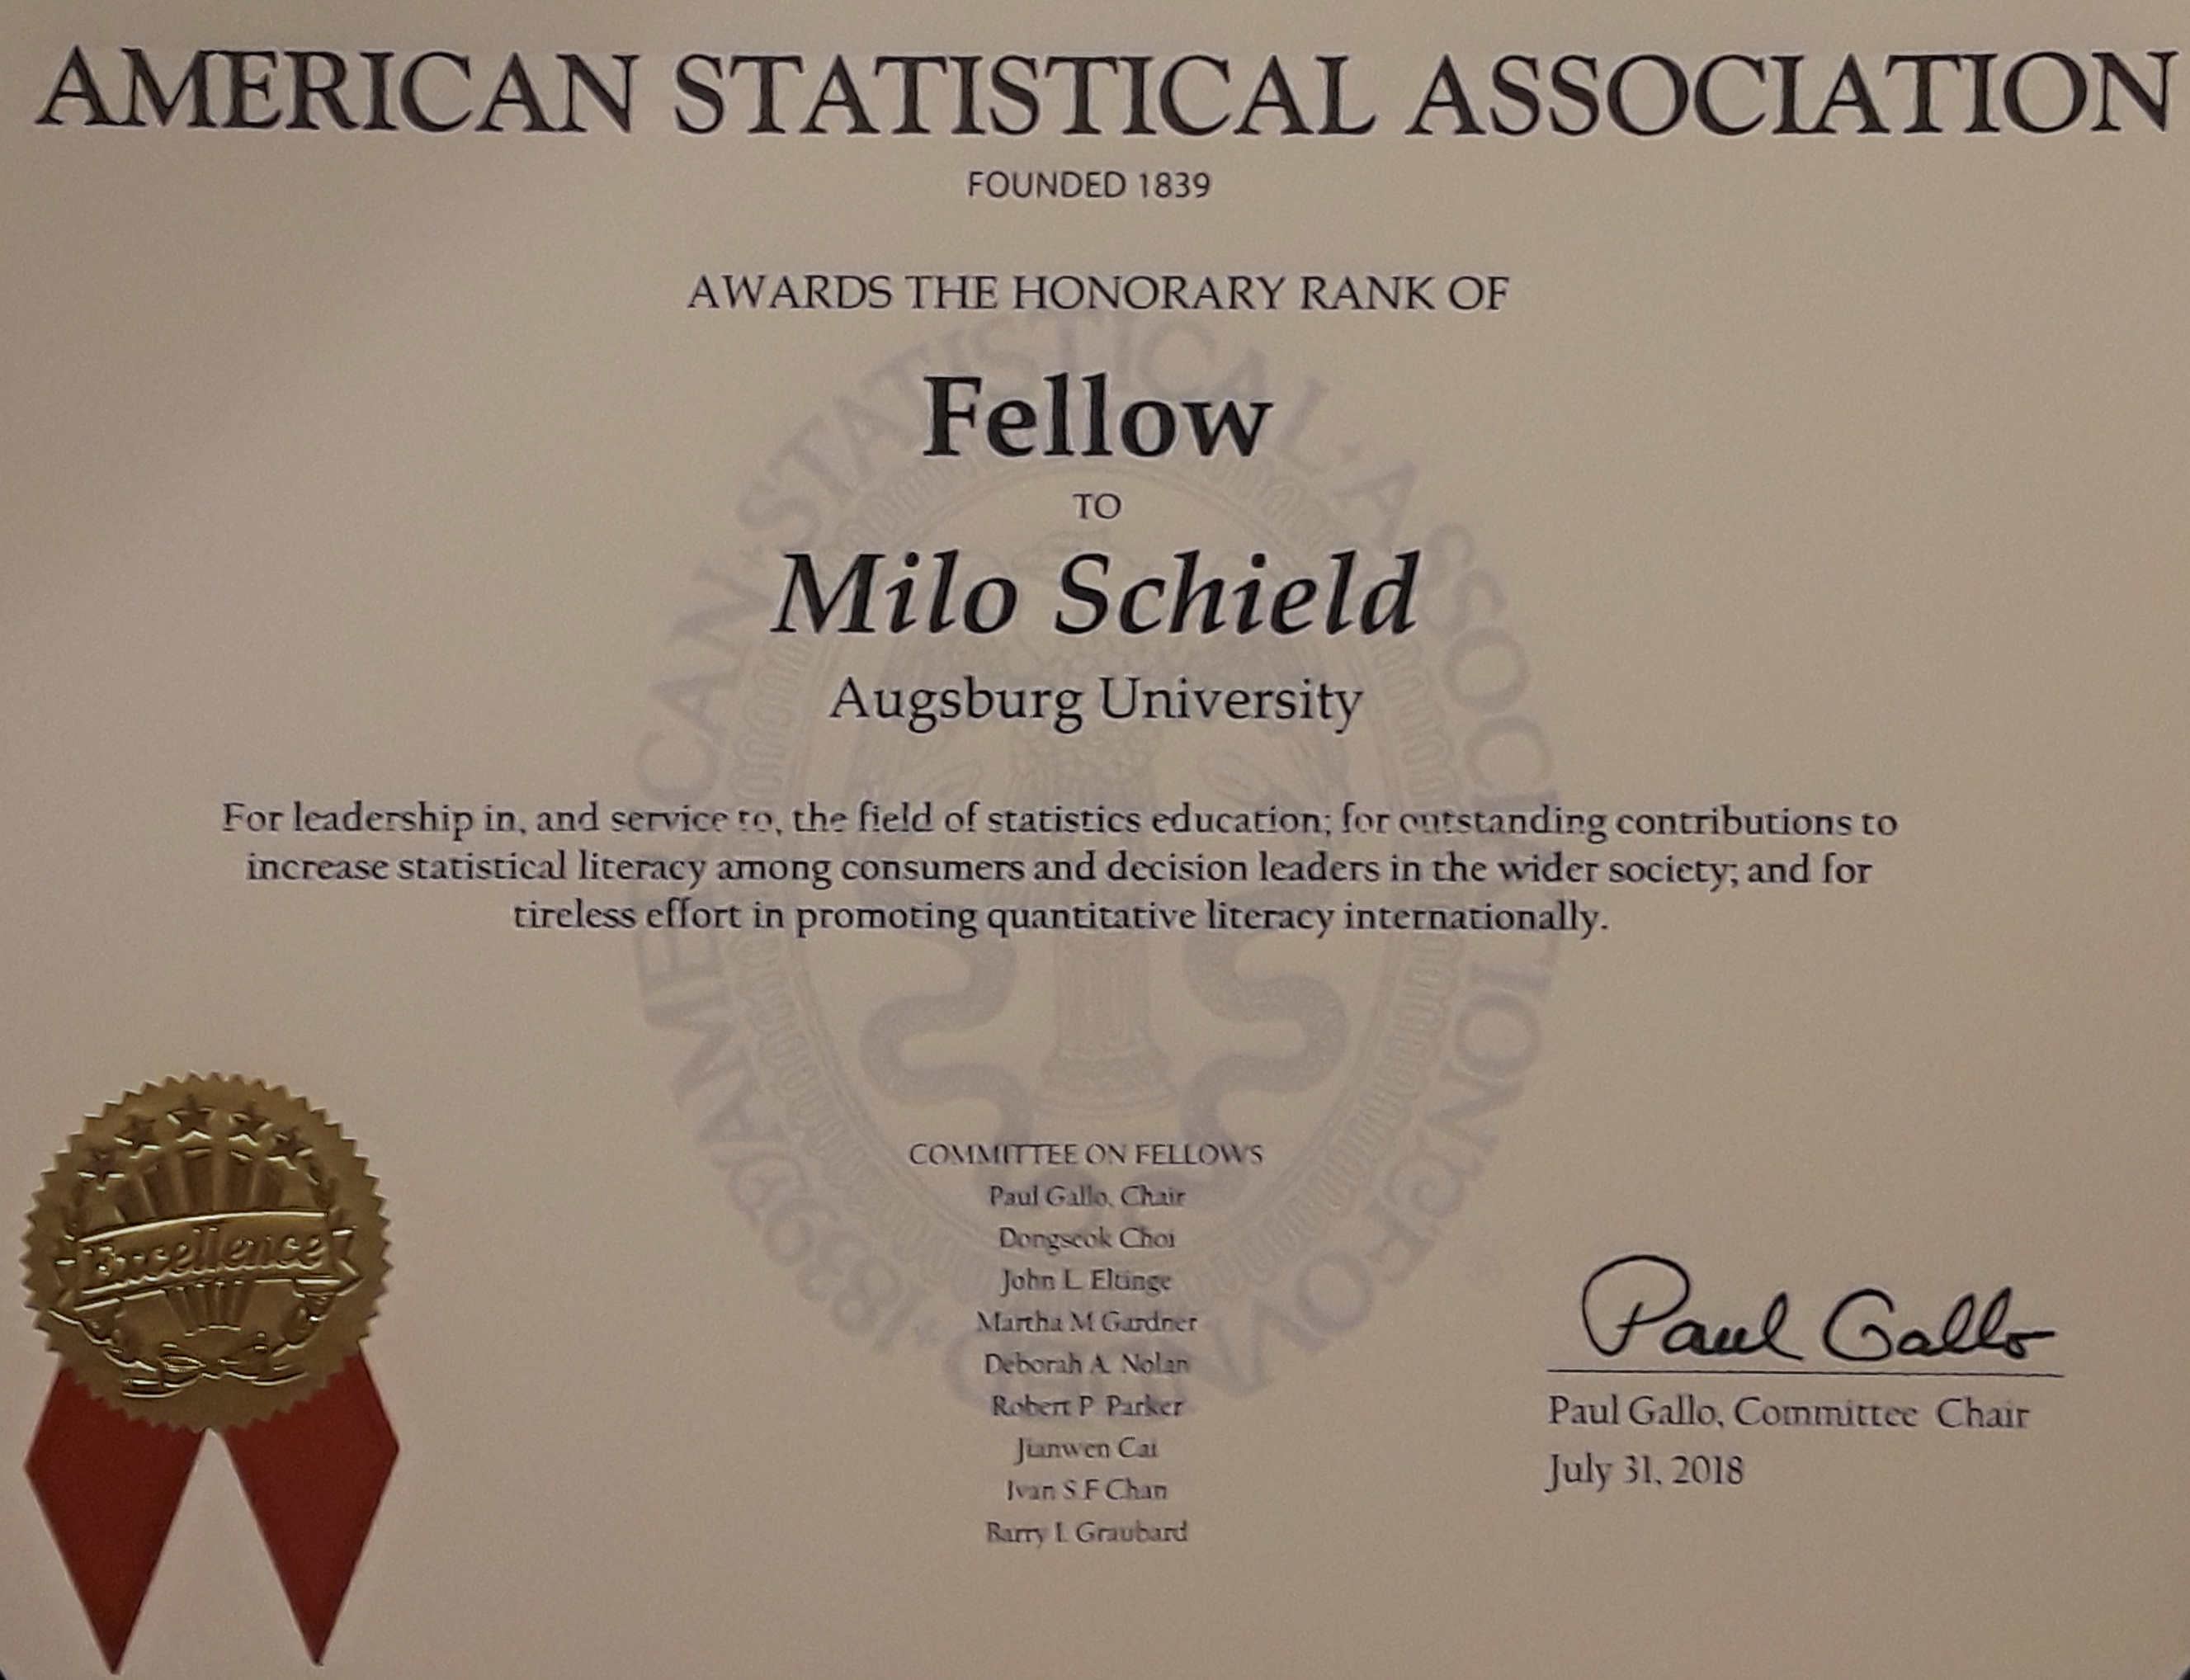
reads as follows: “For leadership in, and service to, the field of
statistics education; for outstanding contribution to increase statistical
literacy among consumers and decision makers in the wider society; and for
tireless efforts in promoting quantitative literacy internationally—the
American Statistical Association (founded in 1839) awards the Honorary Rank
of Fellow to Milo Schield, Augsburg University.” Signed by Paul Gallo,
Committee Chair, July 31, 2018.
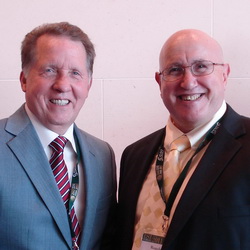
My overwhelming thanks to Carl
Lee (right) who finally convinced me that I might be a worthy candidate.
And to my supporters (below).
Milo Schield
Certificate
ASA President and Milo
Milo and Carl Lee
(Fellow Nominator)
Schield Nominated by Carl Lee. CV Citations Supporting letters by John Bailer, Danny Kaplan, Herb Weisberg, Chris Wild and Jeff Witmer. Certificate
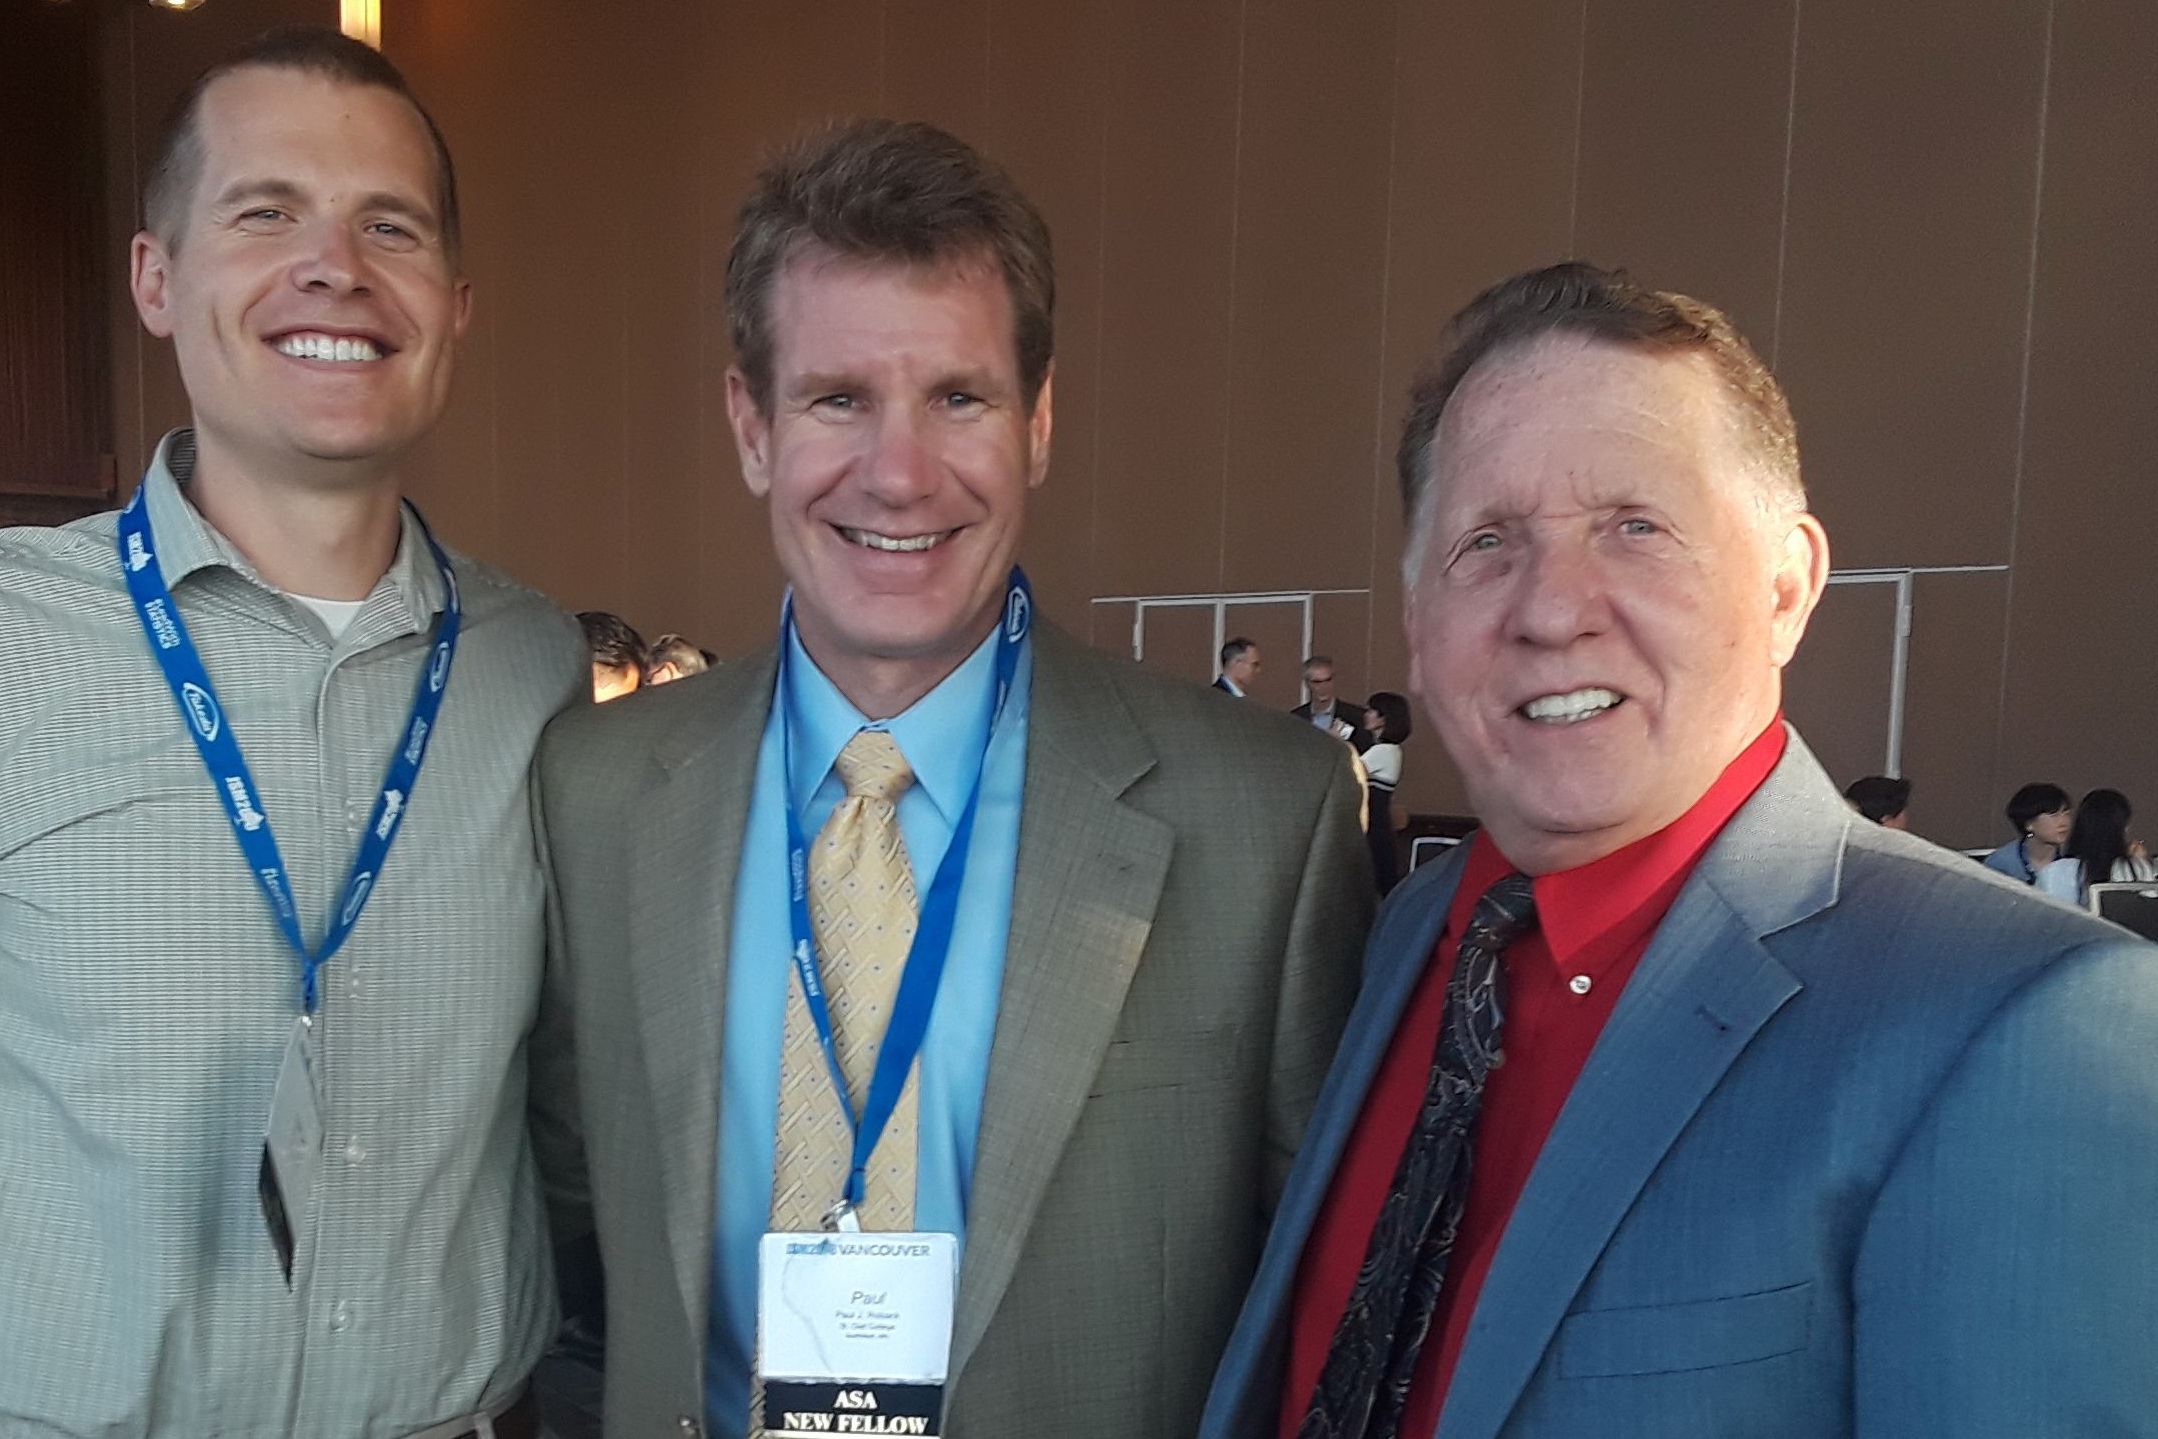
StatEd Fellows (Tintle, Robach & Schield)
Schield and Jessica Utts
Don MacNaughton & Schield (Since 1996)
Schield & DeVeaux
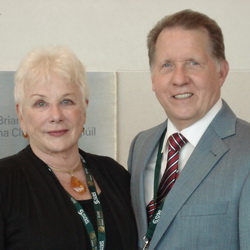
2011: Milo Schield installed as an elected member of the ISI:
At the 21st conference of the International Statistical Institute (ISI), Dr. Milo Schield was elected as one of 56 new members. At the inaugural reception in Dublin Ireland, Milo is shown with Ron Wasserstein (ASA Director), with Dr. A. John Bailar (ISI Membership Elections Committee chair) and with Cynthia Schield (his wife).
Schield and Colleagues:
Danny Kaplan & Schield (Nov 14, 2018)
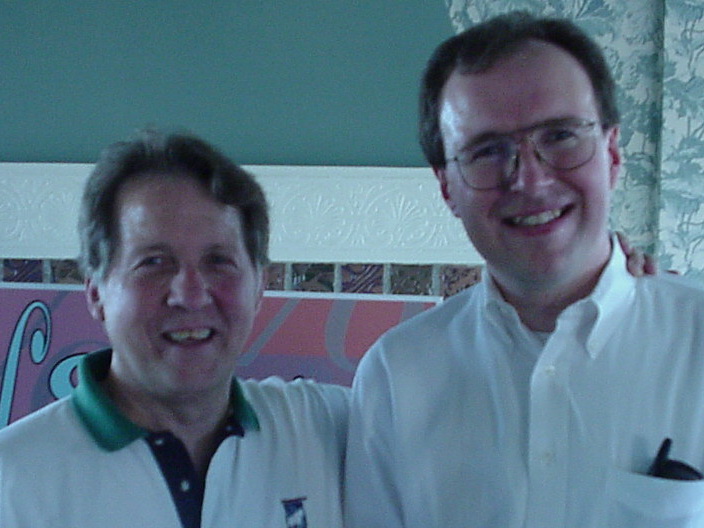
Schield & John Knight (2001)
President Frame, Peter Holmes & Schield
(2003-03/31)
Iddo Gal and Milo (2022-0511: Haifa)
Social/Civic Statistics:
- Gal, Iddo (2022). What Educators Should Know about Teaching Civic Statistics. IASE Workshop Slides 3/2022.
- Murray, Charles (2022). The Immortal Sowell. Claremont Review Winter 2021-22.
Conceptual Literacy and Induction:
- Schield, Milo (2004): Resolving Three Key Problems in the Humanities. New Directions in the Humanities, Prato Italy.
- Schield, Milo (2005): Making Science a Core Liberal Art for the 21st Century. Project Kaleidoscope (PKAL)
- Schield, Milo (2008): Proposal for the Batalden Faculty Scholar Program at Augsburg College. Internal memo.
- Schield, Milo (2009): Promoting Objectivity in Science and Ethics, 6up; Statistical Literacy & Liberal Education 6up. FreeMinds Las Vegas. (Audio of this talk at 2009 FreeMinds by Schield: Track1, Track2, Track3, Track4, Track5, Track6.)
- Schield, Milo (2016): Excerpts from What Should [College] Graduates Know? by Nickolas Lemann, Columbia Dean Emeritus.
- Schield, Milo (2010): Seminar. Part 1: Induction in Science 6up Part 2: Young-Earth Creationism 6up Part 3: Induction in Philosophy 6up
- Schield, Milo (2014): Critical Thinking: Present, Past & Future. St. Paul Critical Thinking Club. CTC1 slides CTC2 slides
- Schield, Milo (1993): Summary of Lewis Carroll's Symbolic Logic (1896).
- Schield, Milo (1993): Analysis of Consciousness. Augsburg Philosophy Seminar.
- Schield, Milo (1991): Summary of Fisher-Houde Handbook of Logic (1954).
Induction Revisited: Recommended readings:
- Induction-Aristotle-Revisited (w Schield + w/o Harriman)
- Biondi and Groarke (Eds): Shifting the Paradigm: Alternate Perspectives on Induction (2014)
-
Louis Groarke:
-
An Aristotelian Account of Induction: Creating Something from Nothing.
See McCaskey's Review. Notre Dame Philosophy Review- A New (Old) Theory of Induction
- Before and after Hume
- A “Deductive” Account of Induction
- Five Levels of Induction
- Moral Induction
- Complete Syllogistic: The Hamiltonian Notation
- A History of Intuitive Induction
- Creativity: The Art of Induction
- Where Science Comes to an End.
- Shifting the Paradigm (Philosophische Analyse) Apr 14, 2014 by Paolo C. Biondi and Louis F. Groarke
-
An Aristotelian Account of Induction: Creating Something from Nothing.
- David Harriman: The Logical Leap: Induction in Physics. See McCaskey's Amazon review.
-
John P. McCaskey:
- Myths in the history of Induction PowerPoint 2013,
- When Induction was about Concepts 2011 (Draft)
- Professor Higgins’ Philosophy of Science: Why Can’t Induction be More Like Deduction? (Draft)
- History of the Relationship between Concepts and Induction 2010 PowerPoint
- Whence the Uniformity Principle 2010 Abstract PowerPoint International Society for the History of Philosophy of Science
- Bacon’s Idols and Harvey’s Eggs 2010 Abstract PowerPoint International Society for the History of Philosophy of Science
- Freeing Aristotelian Epagôgê from Prior Analytics II 23. Apeiron, December 2007, pp. 345–74.
- PhD Thesis (2006): Regula socratis : the rediscovery of ancient induction in early modern England. Abstract
- Induction and Concept-Formation in Francis Bacon and William Whewell 2004
- Masters Thesis (1997 Stanford): Chronology and causes of the ancient mystery religions.
- Quee Nelson's “The Slightest Philosophy.” Front and back covers
- John P. McCaskey's resignation from the Board of ARI and the Board of the Anthem Foundation. Dianna Hsieh's chronology.
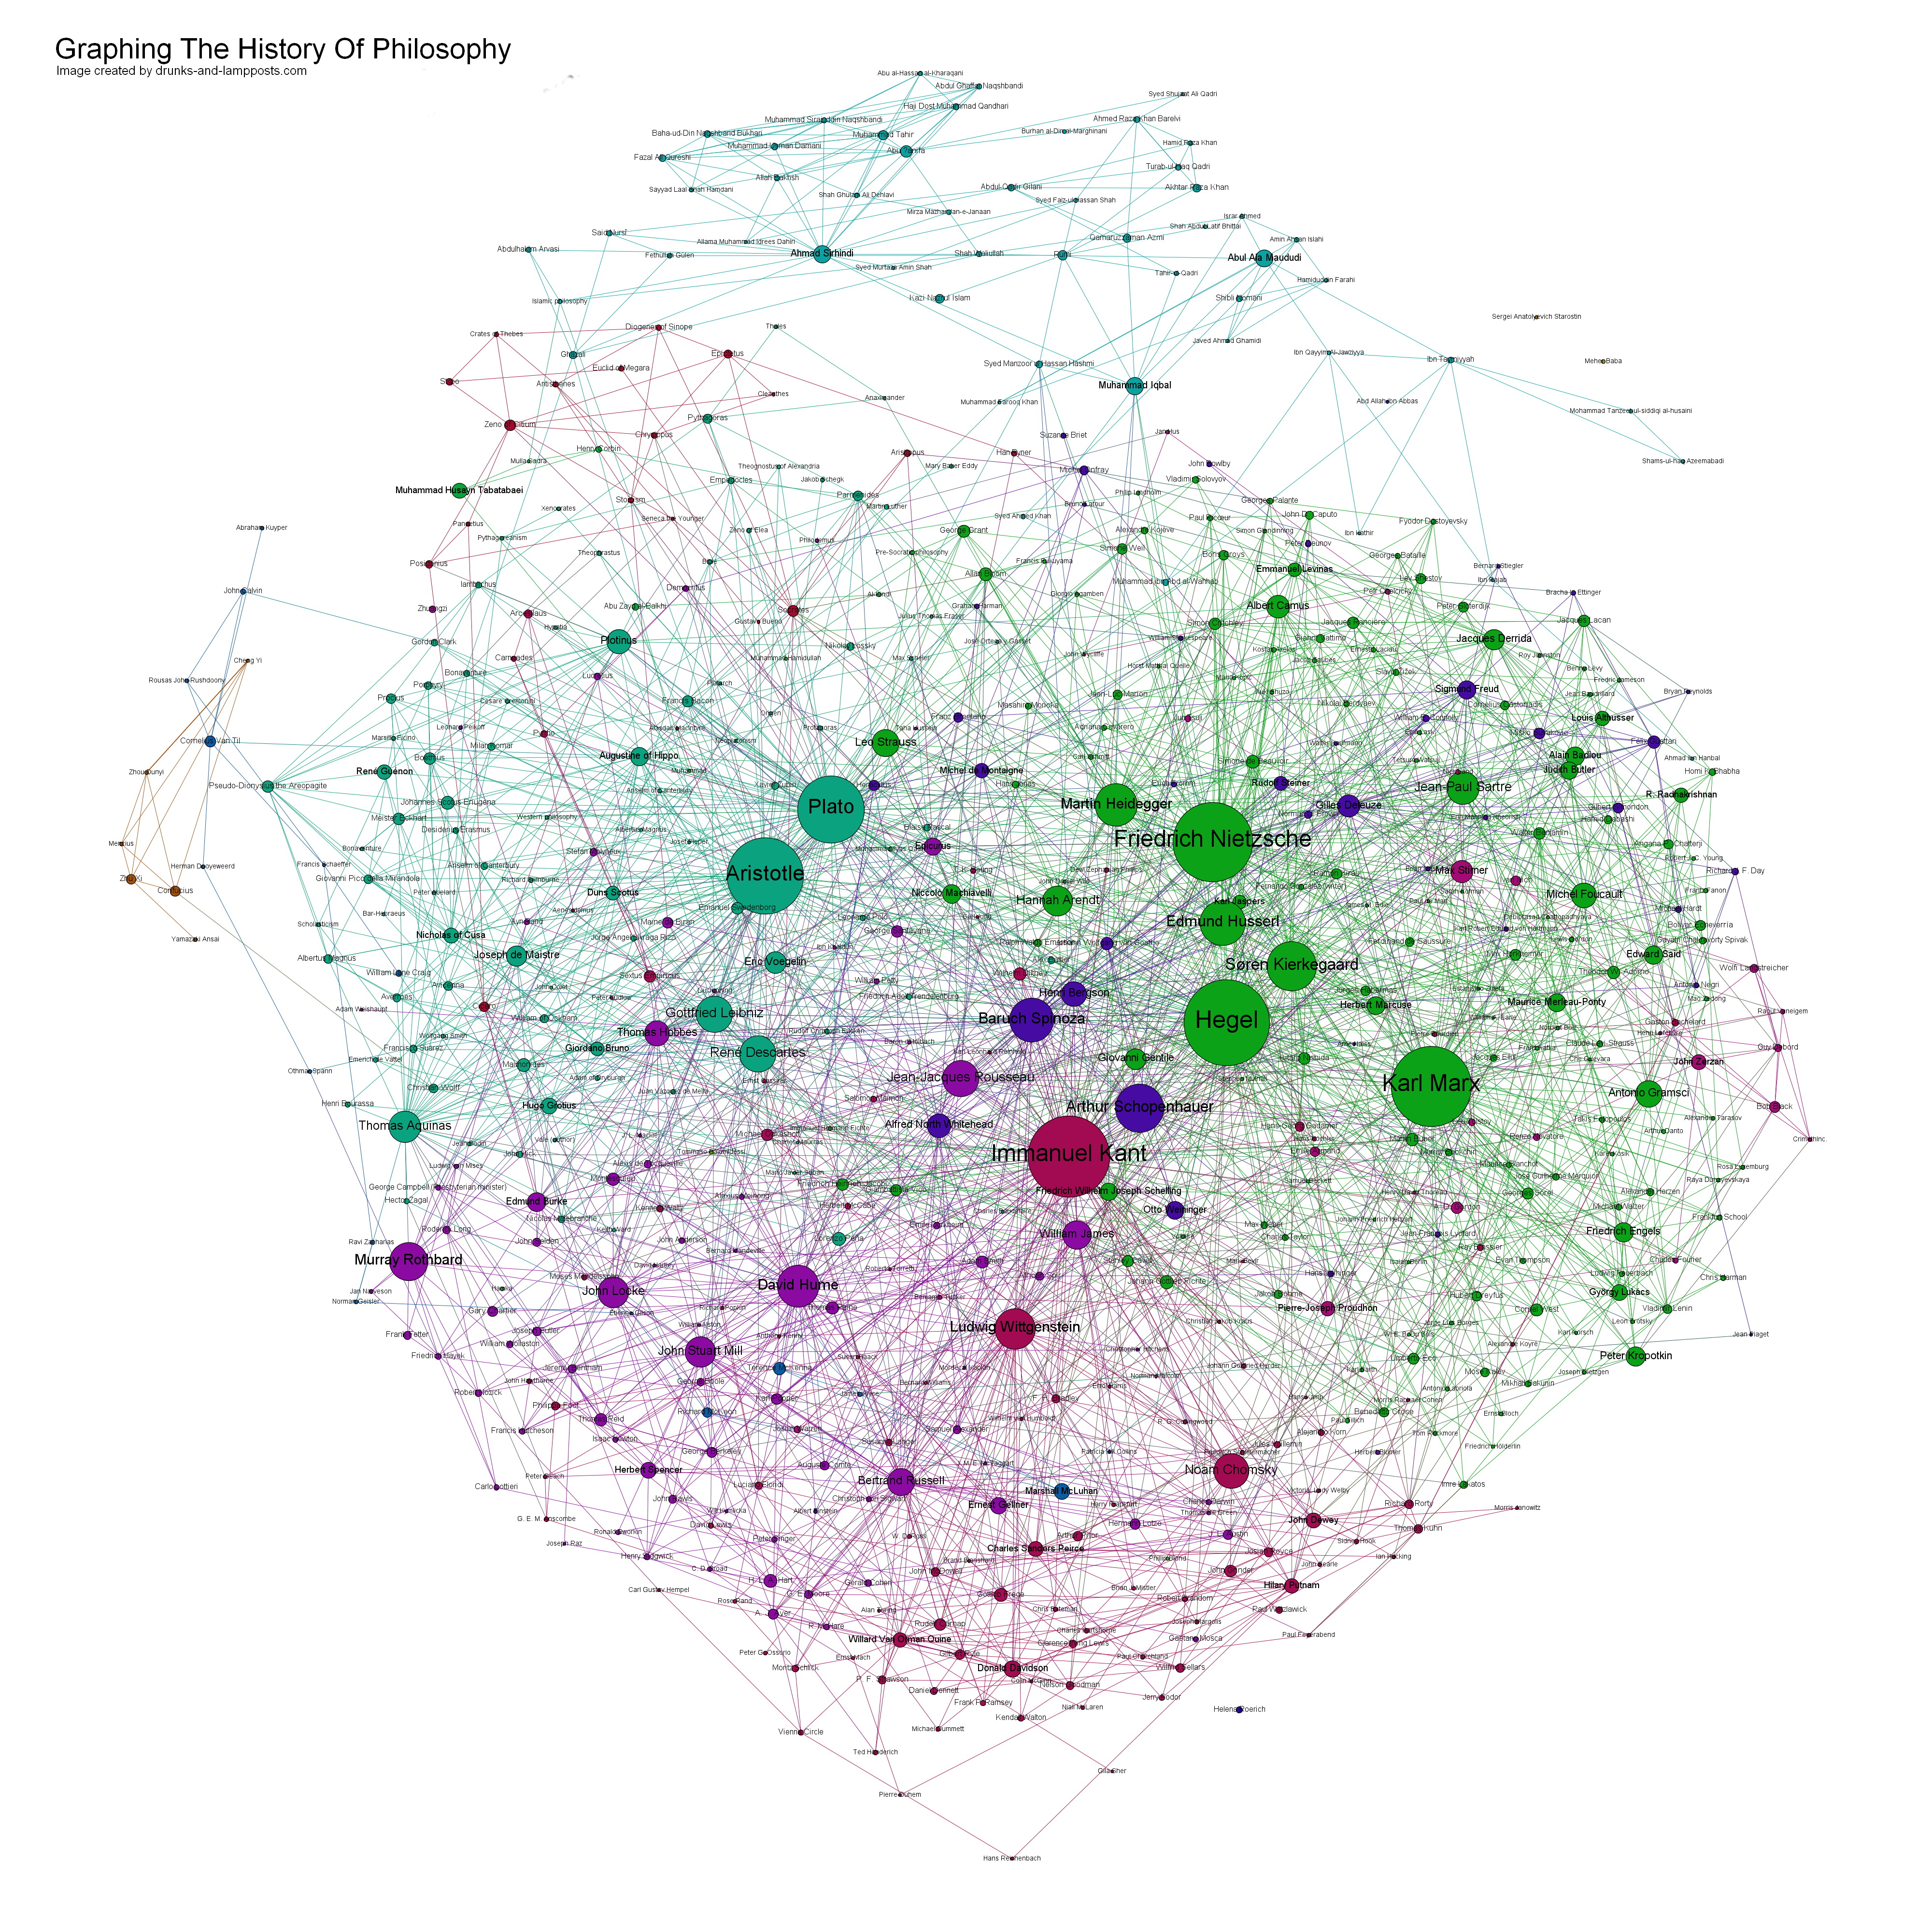
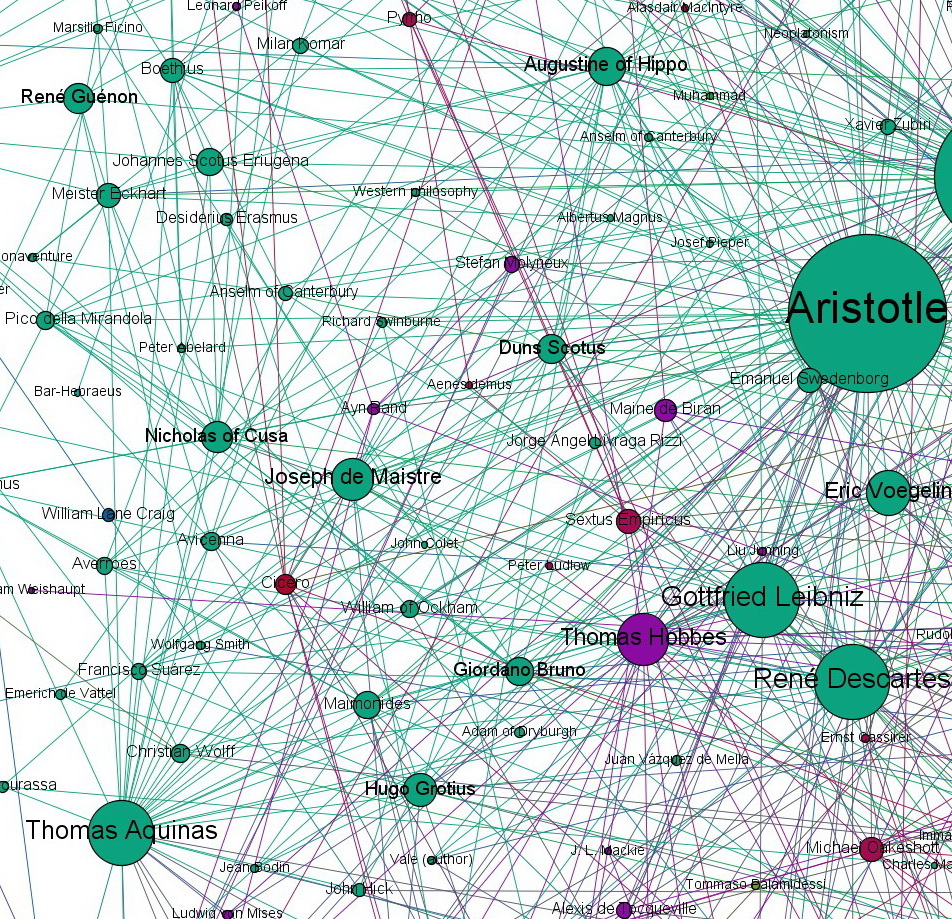
- Wikipedia Philosopher graphics by Simon Raper in Graphing the History of Philosophy. Aristotle-Aquinas philosopher web
Objections:
- Huemer, Joseph Dr. (1999), Why I Am Not an Objectivist. Papers and books
- Robbins (2006): Without a Prayer: Ayn Rand and the Close of Her System.
- Yang (2000): Reconsidering Ayn Rand.
Epistemology/Concepts and Mathematics
- How the Martians Discovered Algebra: Explorations in Induction and the Philosophy of Mathematics. Roger Bissell (2014)
- Mathematics is about the World. Robert E. Knapp (2014) Website Amazon
- Universals and Induction by David Kelly (1988).
Augsburg College:
- 2015: Augsburg's Above-Average Value-Added Education, Faculty Meeting Augsburg College PPTX
- 2008: Statistical Literacy (GST 200) as a QR “Quantitative Applications” (QA) Course with project , 2008 Augsburg College
- 2007: Statistical Literacy (GST 200) as a QR “Quantitative foundations” (QF) Course , 2007 Augsburg College
- 2000: Application for Promotion. Augsburg College
- 2000: Proposal for a Business Leadership concentration in the Master of Arts in Leadership program
- 1999: Sabbatical Application. Augsburg College
- 1997: Philosophical Issues in Statistical Inference. Augsburg College. 11/2007 ($300 for Online course)
Space Physics:
- 1968: PhD Dissertation: The Configuration of Geomagnetic Field Lines above the Auroral Zones , Rice University. Alexander Dessler, Advisor
- 1969: Pressure Balance Between Solar Wind and Magnetosphere. Journal of Geophysical Research. Vol 74, No 5. p 1275-1286. Correction.
- 1969: A Source for Field-Aligned Currents at Auroral Latitudes. M. Schield, J. W. Freeman and A. Dessler. JGR Vol 74 No 1. p. 247-256
- 1970: Electron Observations between Inner-Edge of the Plasma Sheet & the Magnetosphere. M. Schield & L. Frank. JGR 75,128. 5401-5414
Personal: Performing, Family and Teachers
Performing: Alive & Kicking
- 2018 Flashback. Cynthia: Marilyn Monroe; Hey Good Lookin'. Milo: Giant Sequoias; Diamonds are a Girl's Best Friend.
- 2017 Unsung Heroes. Milo: voice-text: The Little Engine that Could. Cynthia: Thank you for Being A Friend (Medley).
- 2016 The Sixties. Cynthia: voice, Feeling Groovy. Milo: voice I can't Get No Satisfaction. Milo & Cynthia Schield 2016 performance.
- 2015 Winds of Change. Cynthia: Voice, Nine to Five (chorus). Milo: Voice, When I was Seventeen. Prescott Story
- 2014 Making History. Cynthia: Voice, Somewhere Over the Rainbow. Milo: AIDs story (audio), Sorry, I Couldn't Tell You.
- Prescott Journal article: A&K: Prescott Singing Coach Trains Two for Bloomington Center Production (pdf)
- 2013 Flashback.
- 2012 Look on the Bright Side. Cynthia: Voice, Love Will Keep Us Together. Milo: Voice, Alive & Kickin show: Cast
- 2011 Minn. State Capital.
- 2011 Always Look on Bright Side.
- 2012 Love is Alive Trailer #1.
- 2012 Love is Alive Trailer #2.
- 2012 Star Tribune Grace Royden Review.
- 2012 Star Tribune Pictures: Cynthia singing.
- 2011. Cynthia: Voice Song: Send in the Clowns. 3/05; High Hopes. 9/04
- 2010. Cynthia: Voice Song: Just You Wait 9/21
- 2009: Cynthia Voice Song: Somewhere Over the Rainbow.
- 2008.
- 2007. Cynthia: Voice
- 2006. Cynthia: Send in the Clowns.
Schield Bantam: Wilbur and Vern Schield: Links 2020 overview
- 2002 Wartburg's Schield Bantam Video “The Limestone Boys”: 2837MB; 955MB; 381MB. by Grant Price. George Beebe, WSR 1961 [broken]
- Ad; Same video in parts: 0 Milo & Grant; Part1-Overview, Part-2, Part-3, Part 4, Part 5 credits, Part 6 credits, Part 7 Wilbur
Wilbur Schield
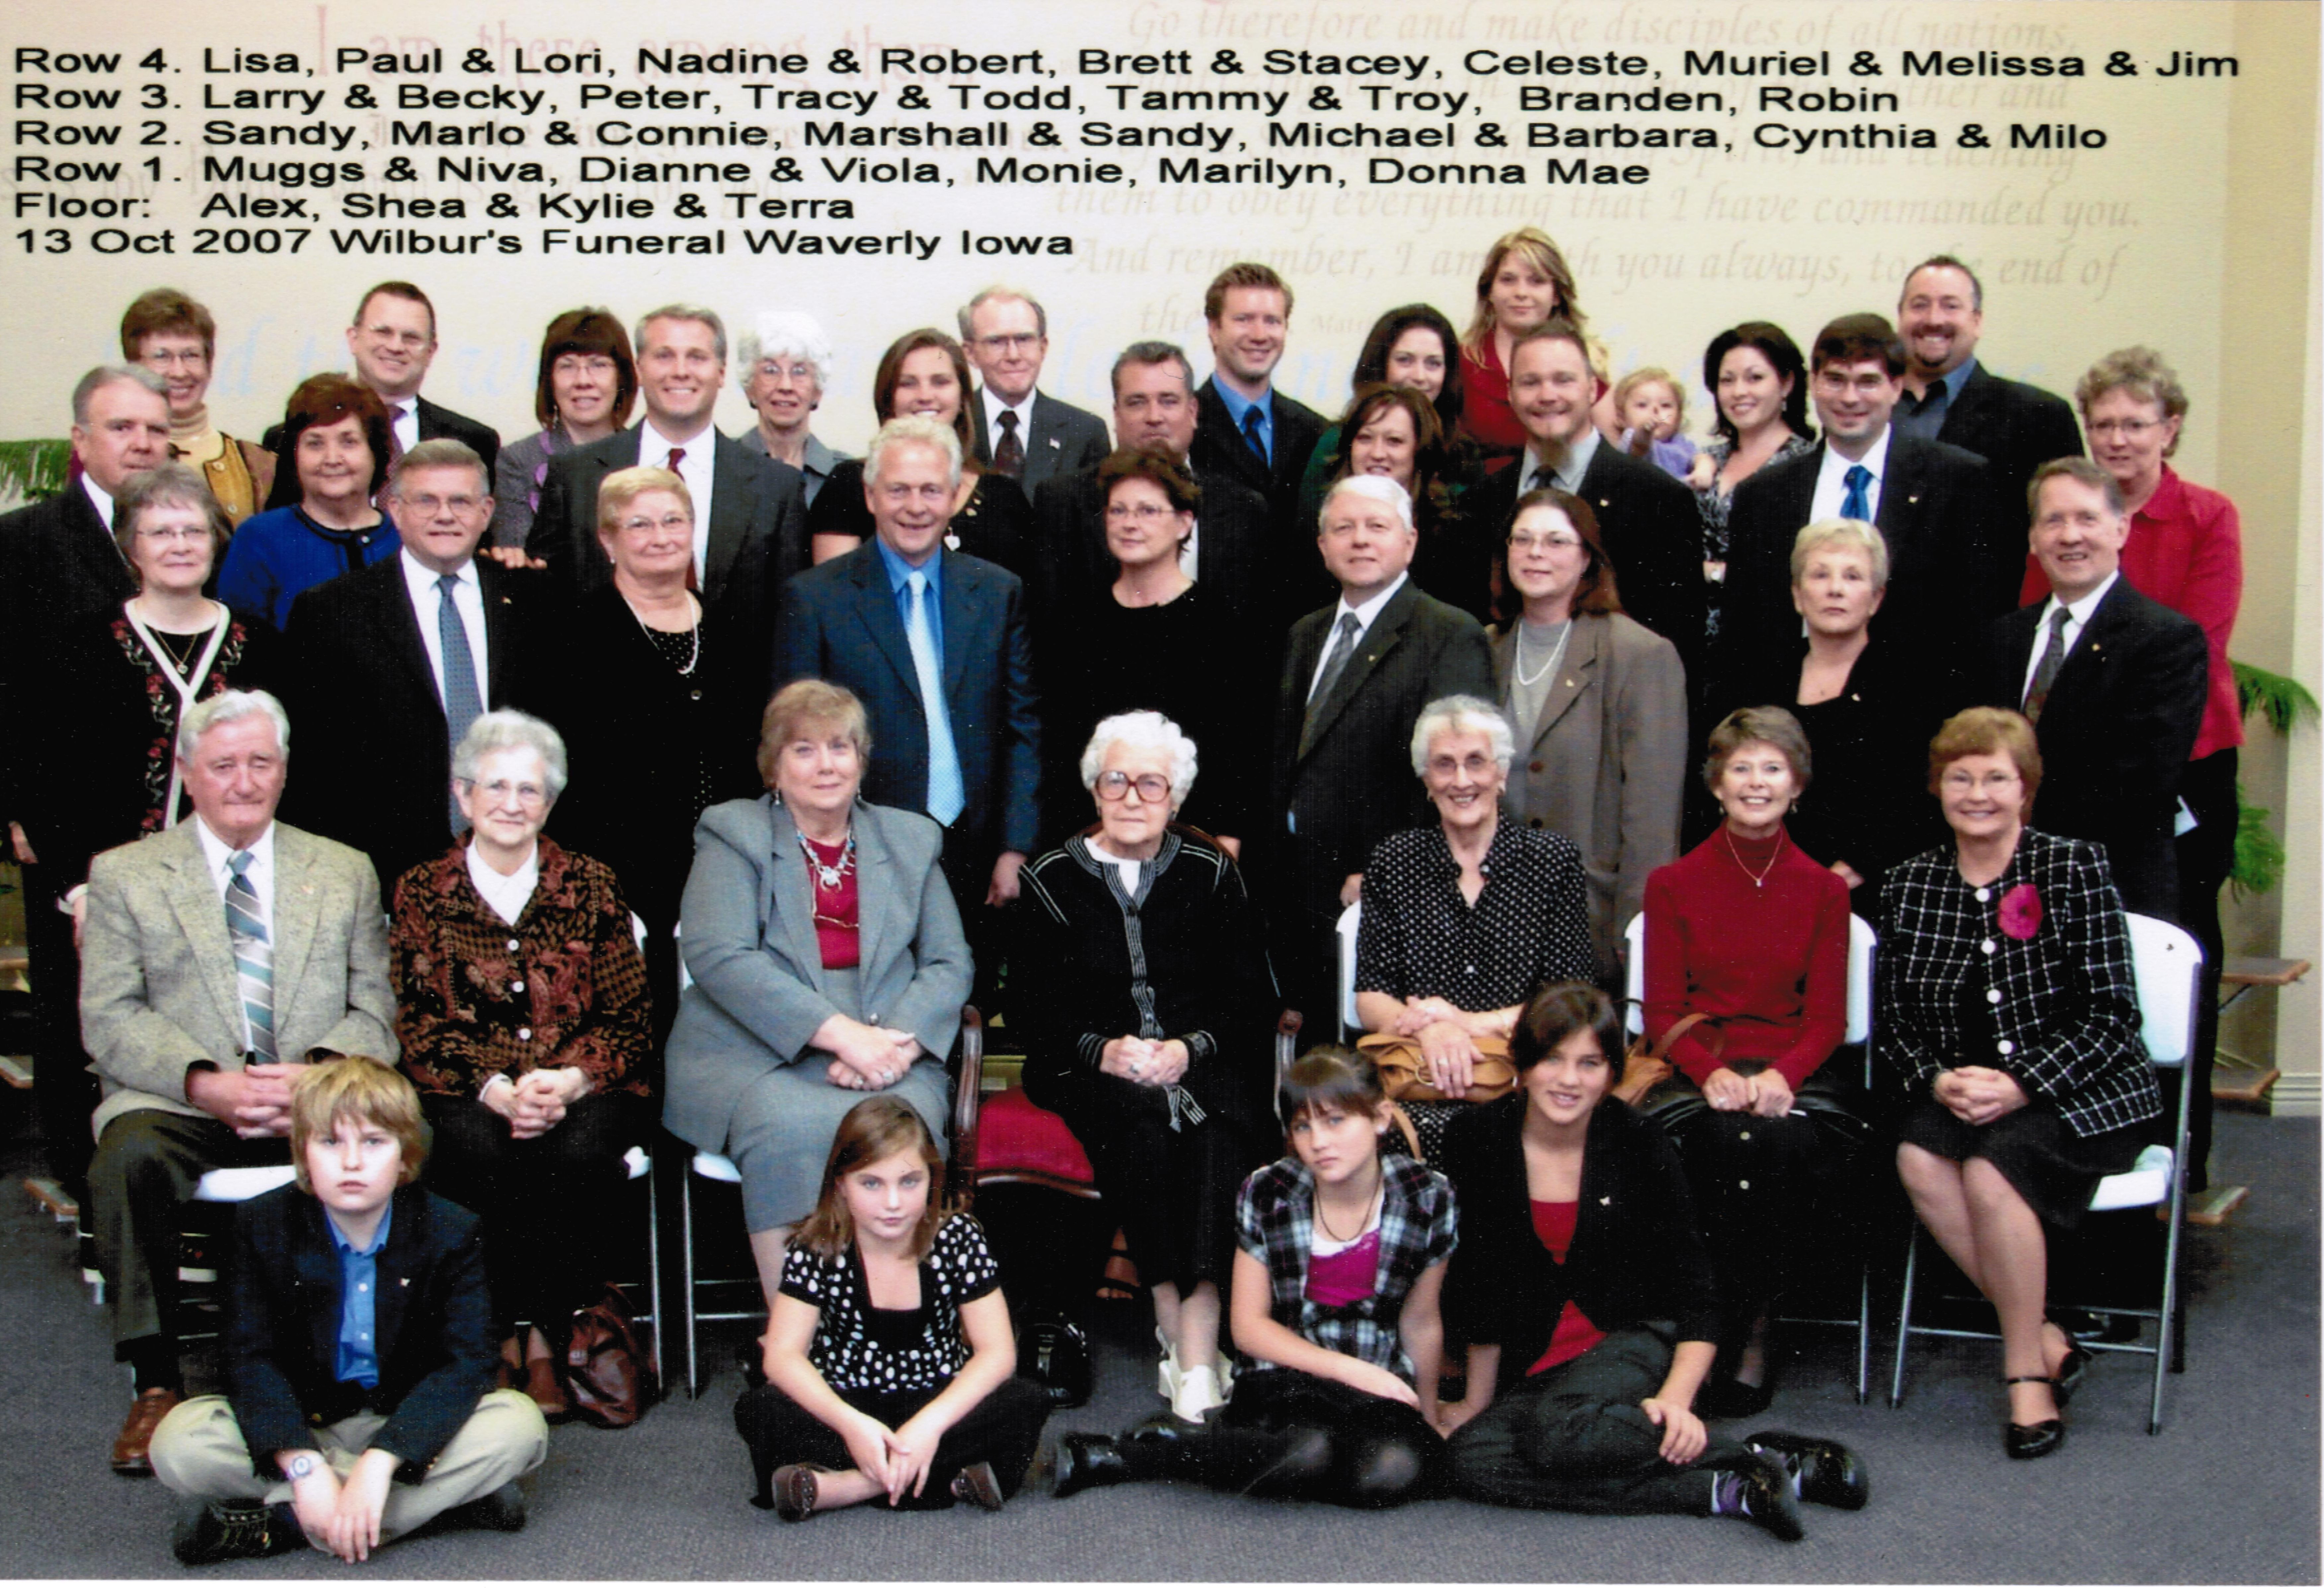
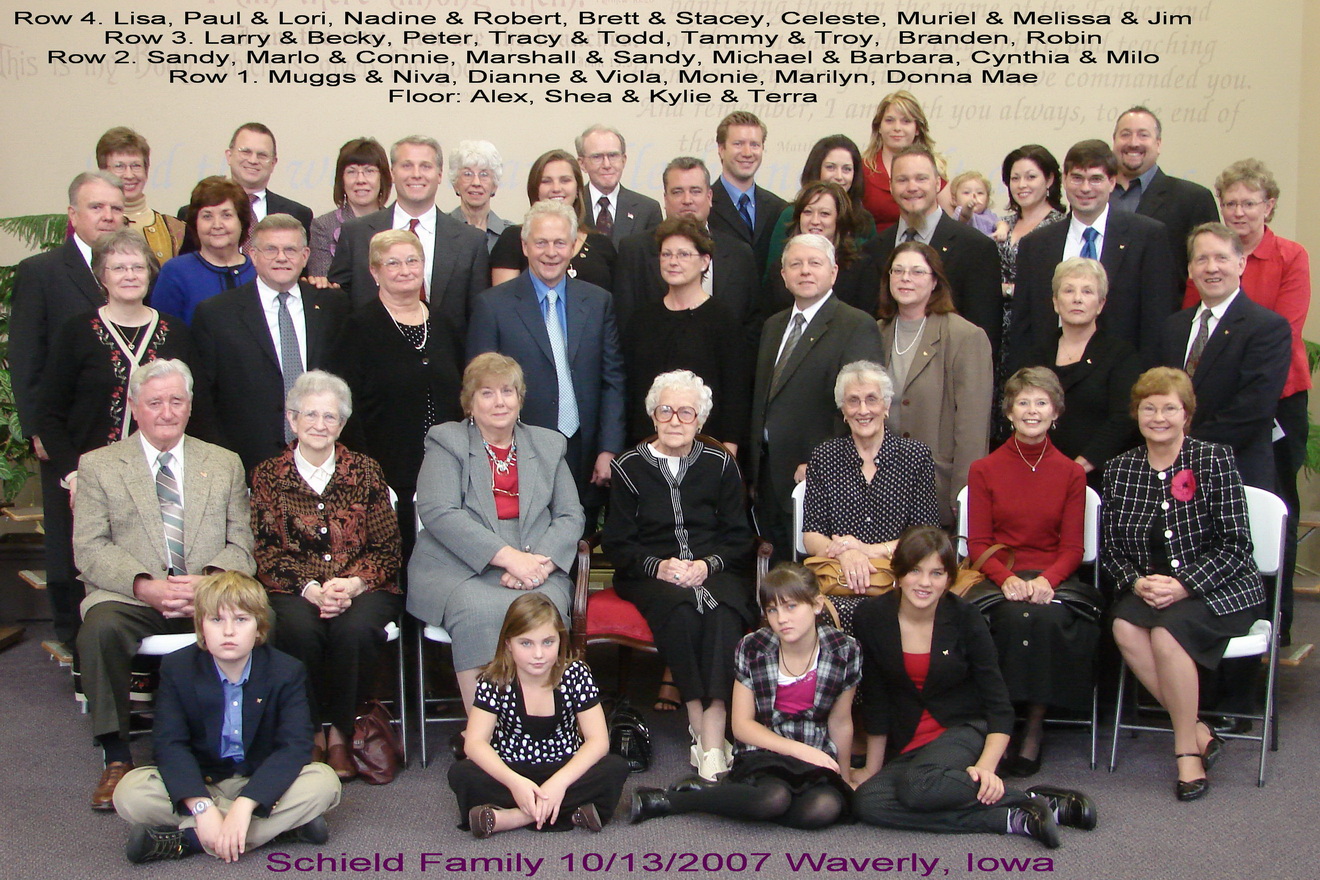
- Wilbur Llewellyn Schield Memorial: RIP 2007 1/28/1909-9/26/2007. 98 years old (4 months after Eileen died) Family1 Family2
- 1928 Moccasin Yearbook Morris Western Agricultural School in Morris MN.
Eileen Schield
- Eileen Bernice (McKelvey) Schield Memorial RIP May 2007 15 May 1918 - 29 May 2007. 89 years old.
- Eileen Schield: Major Decisions in Life (11/2003)
- Eileen McKelvey: Her Early Years (in five parts): A, B, C, D and E. ALL FIVE (25mb)
- Eileen English composition: Somerset Maugham 1934. Rocky Grove High School news “Rock Talk” May 1935 Color Gray-OCR
- Anderson College Yearbook Excerpts: 1936, 1937, 1938.
Fred Schield Family
Brochure: Chronicles of Fred and Emma Schield’s Family: Focus on Wilbur and Vern Schield and Schield Bantam Co 1997
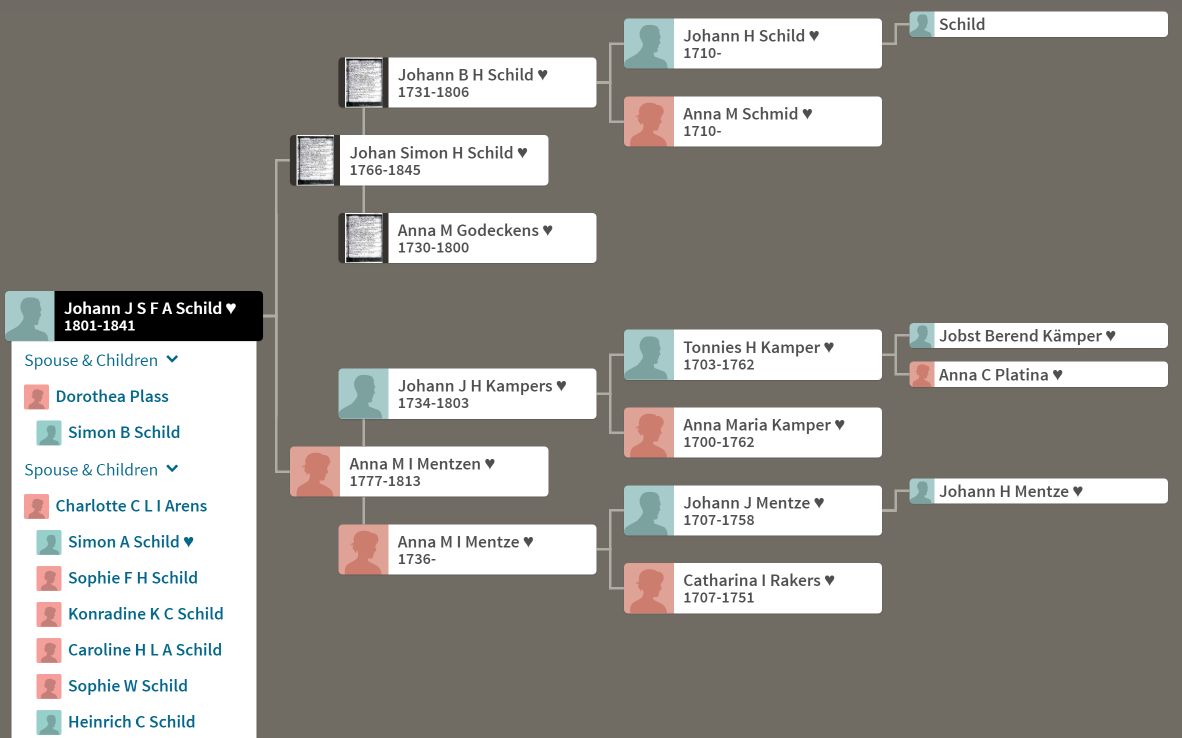
Genealogy:
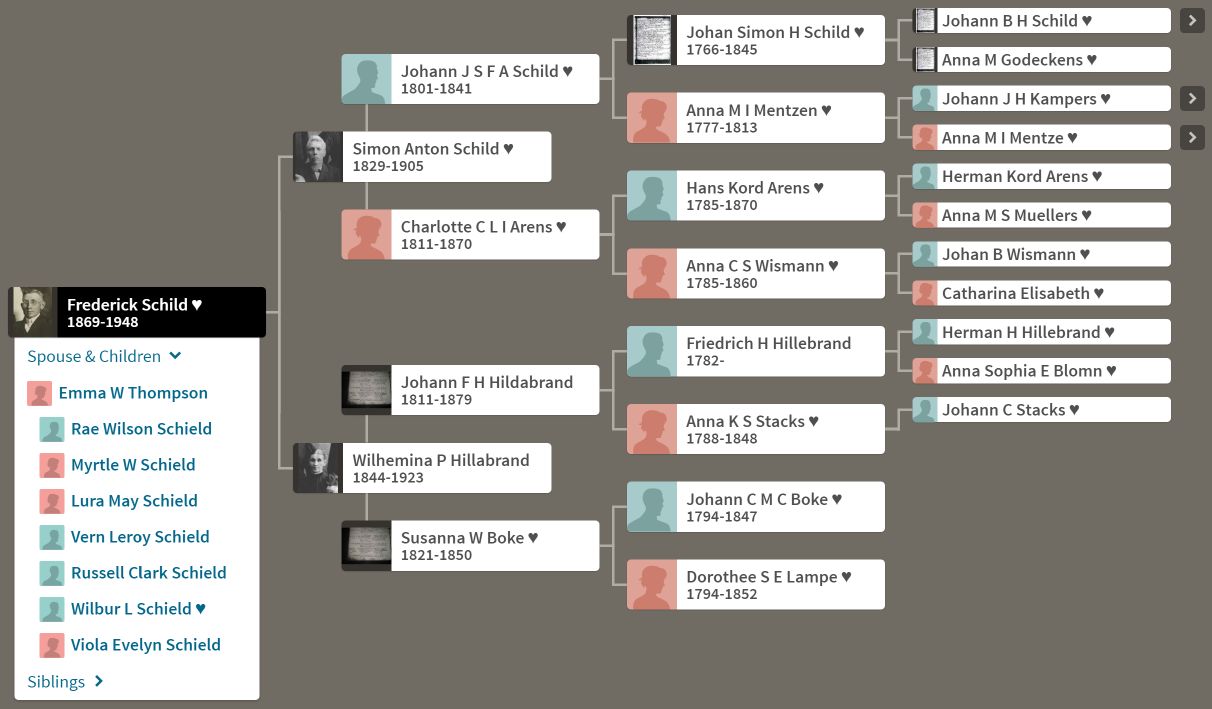
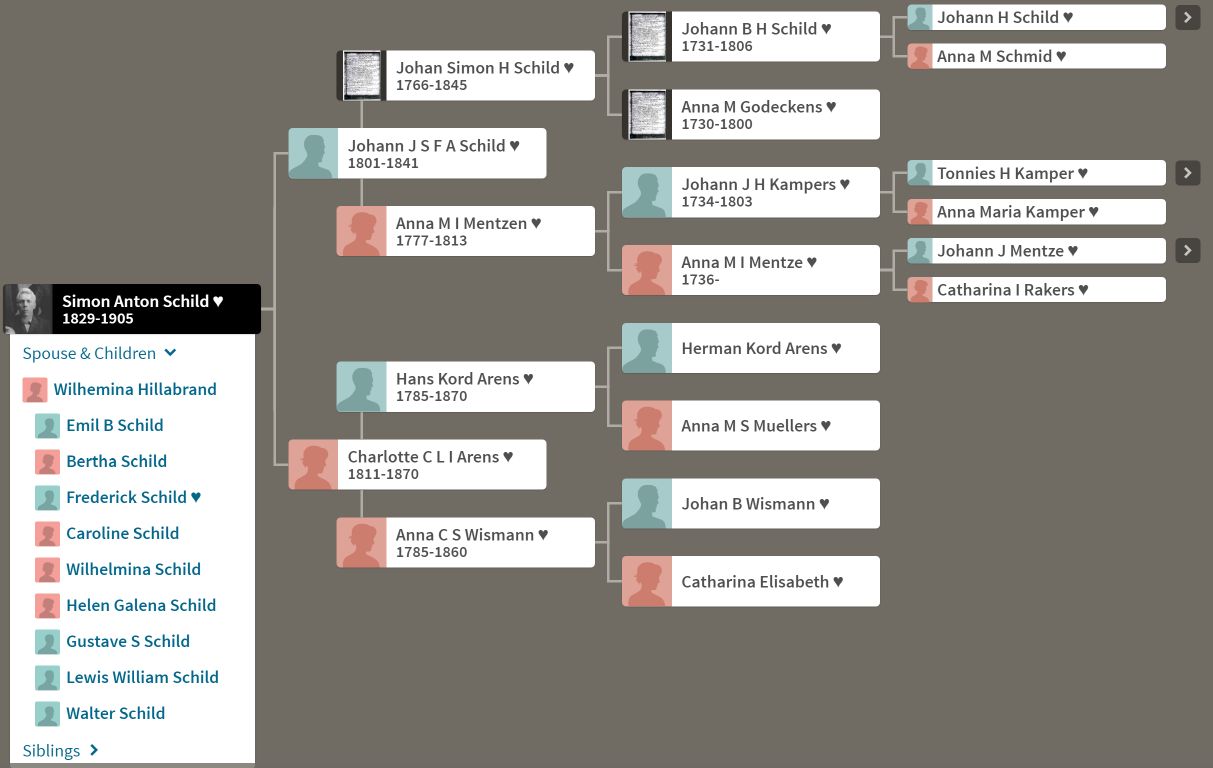
- Pedigree: Wilbur Schield 1909-2007. Fred Schild 1869-1948. Simon Schild 1829-1905. Johann JSFA Schild 1801-1841.
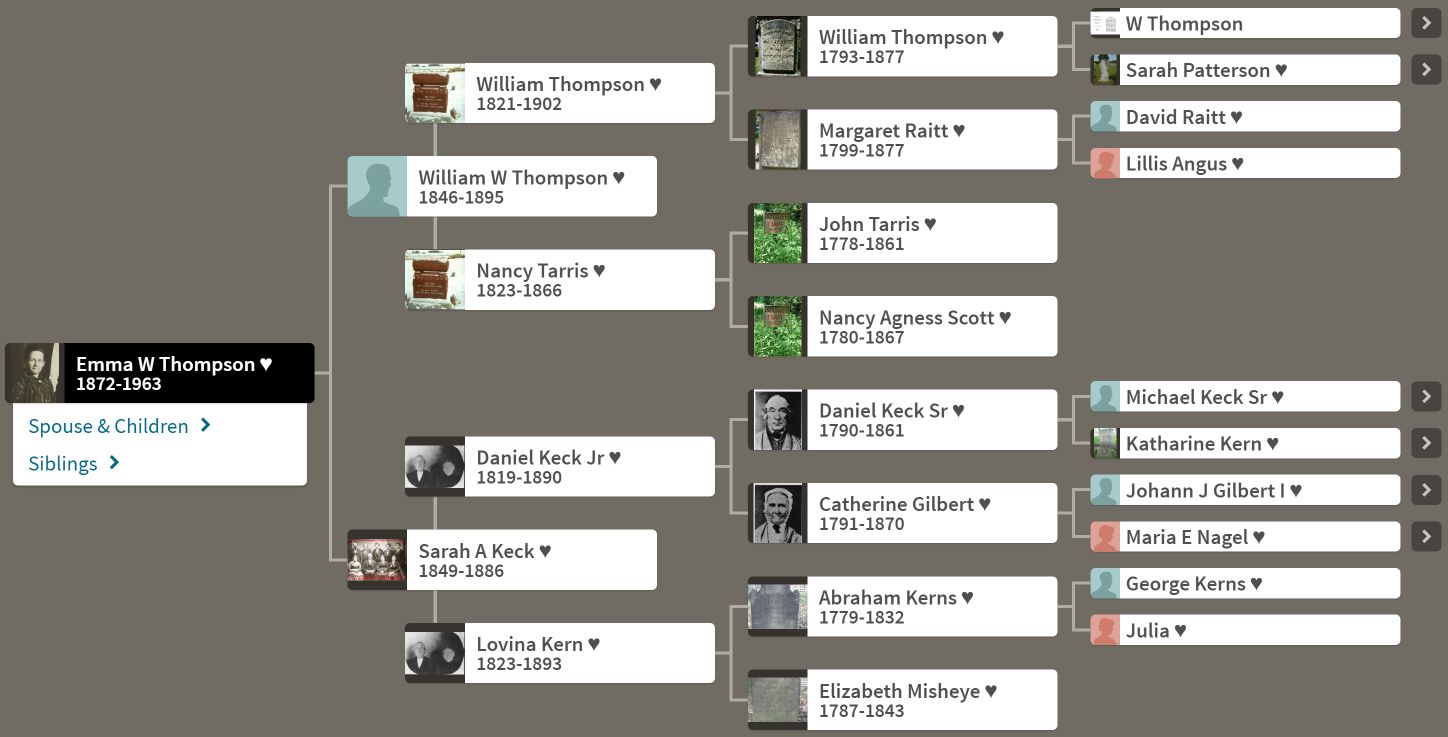
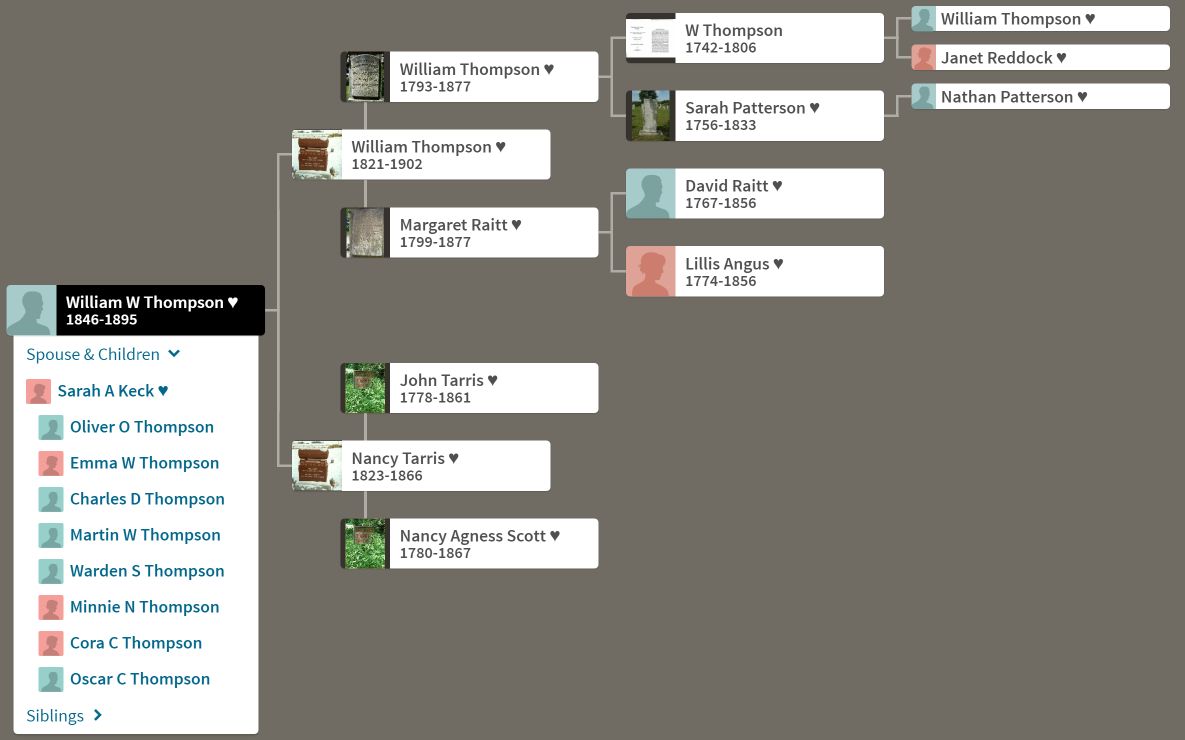
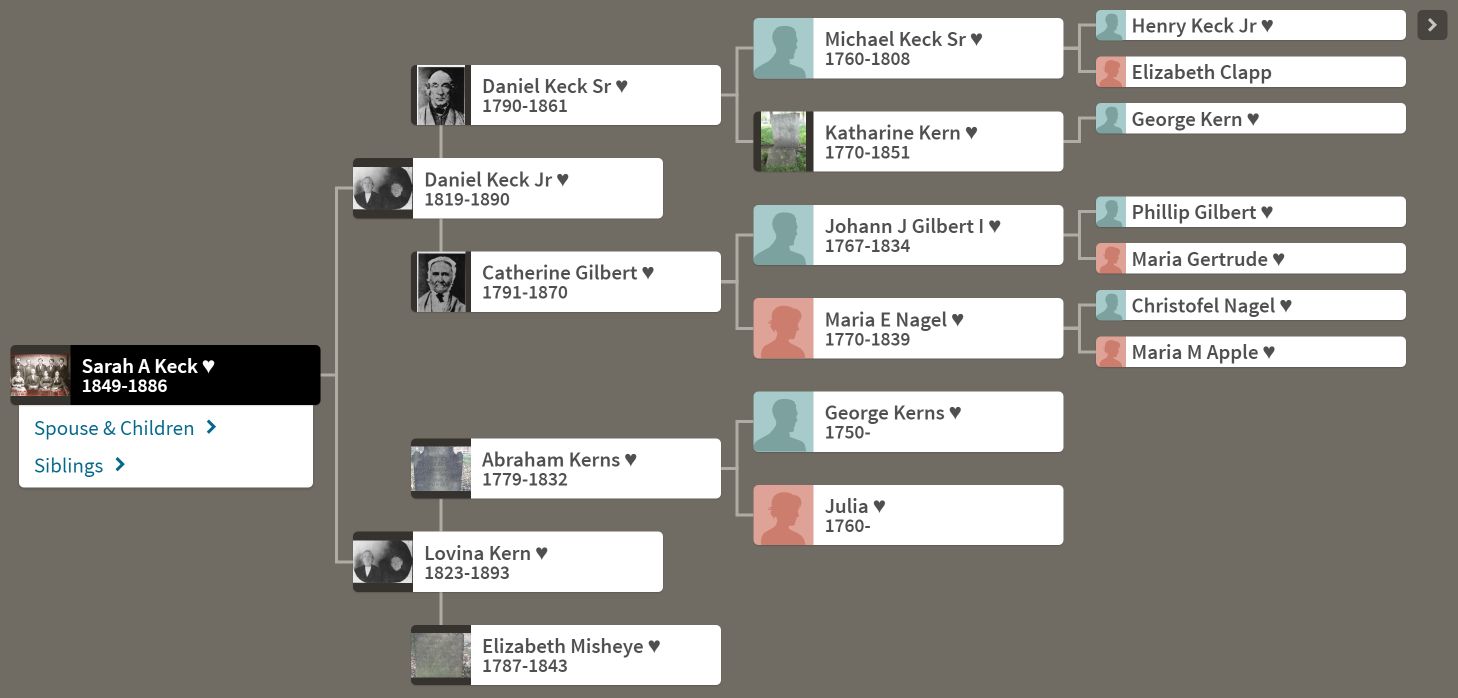
- Pedigree: Emma Thompson 1872-1963. William Thompson 1846-1895. Sarah Keck 1849-1886.
- 1895-1945 “These 50 years” in honor of Fred and Emma Schield from their children. 1896 Thompson Family Bible
- 1919-1930 Fred-Emma Family Farm in Chippewa County, MN. (Rosewood Township) near Montevideo.
- 1892-1919 Sioux County Iowa: Fred & Emma Schild family farm
- Simon Schild: Maps of Bellenberg Germany and Benton County Iowa (2014)
- Schild family From Germany to America (2002)
- Johan Friedrich Christian Schild and Johanne Catharine Margarete Meyer
Videos:
- Milo's page at YouTube http://www.youtube.com/channel/UC3VuPH-W4RtFb4lSzDz-7lA
- 1942-46 Fred Schield Family P1: http://youtu.be/elyS9uuP48g Part 2: http://youtu.be/buIst3N8zn4
- 1970 Vern Schield Canoe Expedition — Part 1: http://youtu.be/VK6AzzrQTjc Part 2: http://youtu.be/2xsgmUWg0Gg
- Lillian Schield 100th birthday: July 7, 2000 Part 1: http://youtu.be/QurHMfMWwT0 Part 2: http://youtu.be/4v8LuerBx2Q
McKelvey-Rowe Family:
Pedigree and geography: Thanks to Michael Schield.
- Eileen McKelvey Schield 1918-2007.
- Maps of McKelvey Homestead, Donegal Ireland.
- Alexander Thomas Rowe 1874-1967.
AT Rowe:
- 1913: Workers Journal.
- 1927: Dwight L. Moody: The Soul Winner (1-13)
- 1927: Ideals for Earnest Youth. (1-15 and 222-224)
- 1944: Ideals for Christian Service (1-17 and 116-117)
- 1943: Tommie Rowe (AT & Ida's son) Vertical P1-10; Landscape P10-53
Ida Byrd Rowe (AT Rowe's second wife)
- 1939: At Work with Young People. (1-64: Entire book)
- 1997: Cecil Byrd's Obituary (Ida Byrd's brother)
Clyde E. Rowe books: Obit (AT's brother)
- 1937: Business and Professional Typewriting co-author with Korona.
- 1939: Everyday Law Sidney M. Bliss and Clyde E. Rowe. Heath Publishing.
- 1943: Writing Infrequently-Used Words in Shorthand. (Used a statistical test of hypothesis)
Robert Clyde Mong RIP (1930-2018): Eulogyand Service. AT Rowe's grandson; Olive Rowe's son.
OTHER:
- Dana Arndt RIP (2018). Donald Wurdinger RIP (2020). Dean Schield RIP (1936-2021). Jim Urbach RIP (2002).
- Eulogy for Bob Kuhn(2019). Cyrano Excerpt for Bob Kuhn's Celebration of Life (2019). Louis Frank (2014) Univ. Iowa Obituary.
- Cynthia (2018): ACBL Life Master (2018); Bronze-Life (2020). Prokop Schield (2018): Excelled in Cyber Security Tom Burnham (2018) RIP Remembrance
- Flickinger (Waverly, Iowa math teacher) AA: Let's Keep it Simple by Bob Hickle (1980, Waverly, Iowa) 2012 Ted Cary Obituary
- Pedigree: Cynthia Kingston-Schield 1940-Now Sarah Stats 1835-1895 Jim Mango (1950X pilot picture) Elliot's bike: 9/22/2018
- Cynthia Schield WF Signature Passports (Milo & Cynthia).