|
2004 Fall Stat Lit News: Busy people need concise
updates on what is happening. Two to five e-mails per year.
Easy "cancel" option; no passwords. No other member sees your
name or e-mail address. [Don't join again if you've already
received a StatLit News e-mail ]
|
|
|
|
|
|
 Joel
Best has published the sequel to his best-seller
"Damned Lies and Statistics."
Augsburg
students reviewed this book. They felt it helped them
understand the use and misuse of statistics in reading essays and
listening to debates. The final chapter, 'Toward Statistical
Literacy', is a sobering assessment of the challenges involved in
developing
Statistical Literacy as a course. Joel
Best has published the sequel to his best-seller
"Damned Lies and Statistics."
Augsburg
students reviewed this book. They felt it helped them
understand the use and misuse of statistics in reading essays and
listening to debates. The final chapter, 'Toward Statistical
Literacy', is a sobering assessment of the challenges involved in
developing
Statistical Literacy as a course. |
|
|
|
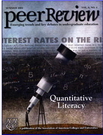
 Lynn Steen is the leading voice of -- and for -- Quantitative Literacy.
His latest book carries on his tradition of listening to many different
viewpoints, staying sensitive to differences, yet searching for an
integration -- a consensus -- on what will work. This volume has
the sharpest focus to date on defining and measuring quantitative literacy in
ways that are strategically relevant and operationally sound. This book is an
absolute 'must-read' for
anyone interested in numeracy for all. Lynn Steen is the leading voice of -- and for -- Quantitative Literacy.
His latest book carries on his tradition of listening to many different
viewpoints, staying sensitive to differences, yet searching for an
integration -- a consensus -- on what will work. This volume has
the sharpest focus to date on defining and measuring quantitative literacy in
ways that are strategically relevant and operationally sound. This book is an
absolute 'must-read' for
anyone interested in numeracy for all.
|
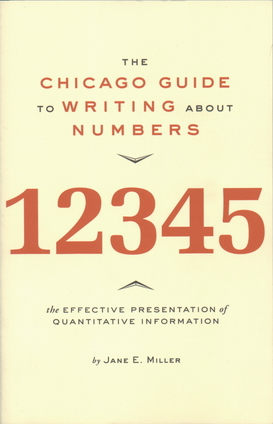 Jane Miller has a great book on the effective
presentation of quantitative information. Reviewer Joel Best says,
"A most original work -- a how-to guide for just about anyone
trying to write (or talk) about numeric data." Reviewer Milo Schield says, "Highly
recommended.
The Chicago Guide
to Writing about Numbers addresses core issues in
statistical literacy." Presents key principles, useful
tools and varied applications. Jane Miller has a great book on the effective
presentation of quantitative information. Reviewer Joel Best says,
"A most original work -- a how-to guide for just about anyone
trying to write (or talk) about numeric data." Reviewer Milo Schield says, "Highly
recommended.
The Chicago Guide
to Writing about Numbers addresses core issues in
statistical literacy." Presents key principles, useful
tools and varied applications. |
|
|
|
|
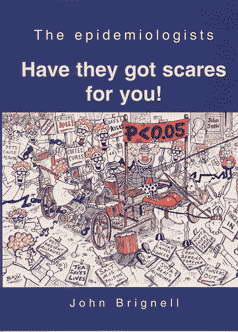 John Brignell reviews contradictory headlines that have
announced or refuted recent health scares and then investigates how this
bizarre situation came about. Reviewer Alan Caruba touted the book
saying, "discover how emancipating it is to
free yourself of the endless stream of lies that passes for science in
the public interest these days." The book is the sequel to
"Sorry, Wrong Number." John Brignell reviews contradictory headlines that have
announced or refuted recent health scares and then investigates how this
bizarre situation came about. Reviewer Alan Caruba touted the book
saying, "discover how emancipating it is to
free yourself of the endless stream of lies that passes for science in
the public interest these days." The book is the sequel to
"Sorry, Wrong Number." |
This new book argues that
"Nearly half of all American adults—90 million
people—have difficulty understanding and acting upon health
information." "Health Literacy is the degree to which
individuals can obtain, process and understand the basic health
information and services they need to make appropriate health
decisions." |
|
|
Other New Books on Numbers 2004 |
|
January 11, 2004 marked the
40th
Anniversary of the Inaugural Surgeon General's Report on Smoking and
Health.
But the 2004 report may be a more significant milestone.
This report redefines key terms such as "sufficient" and "cause."
"Sufficient to infer" means "sufficient to inductively infer causation
[from association] for the purpose of making a public health decision
with few social costs and with considerable social benefit."
If this redefinition changes the practice of science, it may change the
philosophy of science. See the history of wording in Chapter 1 for
association vs. causation. |
|
|
Statistical
|
Education |
|
|
|
 Donna Stroup, CDC
National Center for Chronic Disease Prevention and Health Promotion,
coauthored this paper with Goodman, Cordell and Scheaffer. They
argue that "epidemiology provides a useful and motivating context for
teaching statistical principles." As a means, it emphasizes
tools (such as relative risk and attributable fraction) commonly used
but seldom taught in intro stats. As an end, it focuses on policy
decisions using statistical associations obtained from observational
data. Should intro stats focus more on epidemiological thinking and
measures of association? Donna Stroup, CDC
National Center for Chronic Disease Prevention and Health Promotion,
coauthored this paper with Goodman, Cordell and Scheaffer. They
argue that "epidemiology provides a useful and motivating context for
teaching statistical principles." As a means, it emphasizes
tools (such as relative risk and attributable fraction) commonly used
but seldom taught in intro stats. As an end, it focuses on policy
decisions using statistical associations obtained from observational
data. Should intro stats focus more on epidemiological thinking and
measures of association? |
  "The Challenges in Developing Statistical Literacy,
Reasoning and Thinking" by
Dani Ben-Zvi
and
Joan Garfield, two highly-respected researchers in statistical
education. Although the book is somewhat expensive ($171
US@Amazon), these topics involve the ultimate goals of statistical
education. Dr. Garfield directs
ARTIST: an NSF project to develop "Tools
for Teaching and Assessing Statistical Inference." "The Challenges in Developing Statistical Literacy,
Reasoning and Thinking" by
Dani Ben-Zvi
and
Joan Garfield, two highly-respected researchers in statistical
education. Although the book is somewhat expensive ($171
US@Amazon), these topics involve the ultimate goals of statistical
education. Dr. Garfield directs
ARTIST: an NSF project to develop "Tools
for Teaching and Assessing Statistical Inference." |
|
|
|
|
"A Course in Learning how to Teach Statistics in Higher Education (HE)"
by Neville Davies, Warren Gilchrist and Vic Barnett. This
presentation was delivered at the RSS 2004 conference in Manchester.
It reviews the development of this part-time, web-based course in the
UK. Accreditation is given by the Royal Statistical Society (RSS) and
the Higher Education Academy (HEA). |
Teaching Subject Teaching in Higher Education - A Case for Statistics.
by Neville Davies and Warren Gilchrist. "we believe that a strong
case can be made for the inclusion of discipline-based content in
induction and CPD courses, and for this to be embedded in the
requirements and standards currently being developed."
Published in MSOR Connections Nov 2003 Vol 3 No 4.
Copy |
|
Technical |
Papers |
|
|
|
|
 In
the Summer 2002 issue of Chance Magazine, Howard Wainer, editor of the
Visual Revelations column, described a revolutionary new graphical technique:
"The B-K Plot: Making Simpson's Paradox Clear to the Masses." He
wrote about this graph and Simpson's Paradox in a draft of his
ASA
paper. A new on-line interactive demo is available to see
exactly how this works. In
the Summer 2002 issue of Chance Magazine, Howard Wainer, editor of the
Visual Revelations column, described a revolutionary new graphical technique:
"The B-K Plot: Making Simpson's Paradox Clear to the Masses." He
wrote about this graph and Simpson's Paradox in a draft of his
ASA
paper. A new on-line interactive demo is available to see
exactly how this works. |
 Jim
Terwilliger, the NAEP Coordinator for Minnesota,
presented this paper at the AERA conference in April. Using a simple sufficient condition
and a single confounder, over 100
instances of Simpson's Paradox were found in the 2002 NAEP Grade 8 Reading data.
Of the statistically significant differences, 10%
were reversed. [Editor: Read about 'journalistic significance']' Jim
Terwilliger, the NAEP Coordinator for Minnesota,
presented this paper at the AERA conference in April. Using a simple sufficient condition
and a single confounder, over 100
instances of Simpson's Paradox were found in the 2002 NAEP Grade 8 Reading data.
Of the statistically significant differences, 10%
were reversed. [Editor: Read about 'journalistic significance']' |
|
|
Pre-Inferential Thinking 6/2004 |
|
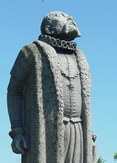 As Tyco Brahe's
statue watched the irregularities in planetary orbits, statistical
educators at the IASE 2004 Roundtable in nearby Lund Sweden discussed two
irregular topics: pre-inferential thinking (see papers presented by Bakker, Pfannkuch and Harradine) and multivariate thinking (see papers
below by Ridgeway & Nicholson and by Schield). As Tyco Brahe's
statue watched the irregularities in planetary orbits, statistical
educators at the IASE 2004 Roundtable in nearby Lund Sweden discussed two
irregular topics: pre-inferential thinking (see papers presented by Bakker, Pfannkuch and Harradine) and multivariate thinking (see papers
below by Ridgeway & Nicholson and by Schield).
|
 Arthur
Bakker and
Maxine Pfannkuch both gave papers on teaching
statistical thinking in schools. Both noted that some questions (Are two
centers the same or different?) may not have simple answers.
Anthony Harradine argued that students should focus on "Within, Between
and Beyond" in moving from observed data to statistical inference. Arthur
Bakker and
Maxine Pfannkuch both gave papers on teaching
statistical thinking in schools. Both noted that some questions (Are two
centers the same or different?) may not have simple answers.
Anthony Harradine argued that students should focus on "Within, Between
and Beyond" in moving from observed data to statistical inference. |
|
|
|
|
  Jim Ridgway and James Nicholson reviewed using
multivariate data sets in English schools. They
said that statistical thinking without multivariate data is "inadequate for informed citizenship in the 21st
century." Jim Ridgway and James Nicholson reviewed using
multivariate data sets in English schools. They
said that statistical thinking without multivariate data is "inadequate for informed citizenship in the 21st
century." |
 The
design of the W. M. Keck Statistical Literacy curriculum
was presented by project
director Milo Schield. This curriculum is for majors that don't
require math, so the focus is on causation, context, conditional
reasoning, confounding and confounder influence on statistical significance
(See also Schield's ICME paper). The
design of the W. M. Keck Statistical Literacy curriculum
was presented by project
director Milo Schield. This curriculum is for majors that don't
require math, so the focus is on causation, context, conditional
reasoning, confounding and confounder influence on statistical significance
(See also Schield's ICME paper). |
Statistical Literacy at ASA JSM 8/2004 |
|
|
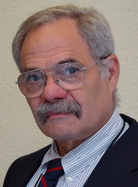
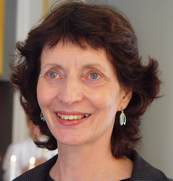
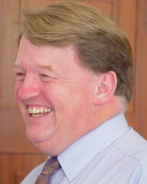
 2004
marked the 7th annual session on Statistical Literacy at the ASA Joint
Statistical Meetings. This year's session involved papers by
authors Stroup (see above), Hayden (right), and Klass (below), and by
Schield (upper right) and Burnham (lower right). Commentator
Brian Jersky (left) reiterated "the crucial need to enhance the teaching
of statistics to include statistical literacy and scientific reasoning." 2004
marked the 7th annual session on Statistical Literacy at the ASA Joint
Statistical Meetings. This year's session involved papers by
authors Stroup (see above), Hayden (right), and Klass (below), and by
Schield (upper right) and Burnham (lower right). Commentator
Brian Jersky (left) reiterated "the crucial need to enhance the teaching
of statistics to include statistical literacy and scientific reasoning." |
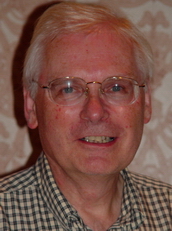
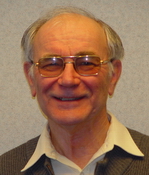
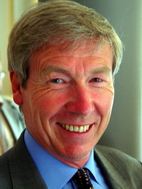
 Bob
Hayden says the first step is to define statistical literacy: "Study
life, not books, to see what students need." "The biggest pitfall ... is
the temptation to make it a watered-down version of the methods course."
A good course should be "inspired by an empirical study of what skills
are actually needed in real life." As a seasoned, highly respected
statistical educator, Bob's thoughts on planning a statistical literacy
course are very cogent. Bob
Hayden says the first step is to define statistical literacy: "Study
life, not books, to see what students need." "The biggest pitfall ... is
the temptation to make it a watered-down version of the methods course."
A good course should be "inspired by an empirical study of what skills
are actually needed in real life." As a seasoned, highly respected
statistical educator, Bob's thoughts on planning a statistical literacy
course are very cogent. |
|
|
|
|
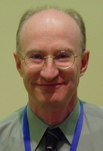
 Gary
Klass teaches
statistical reasoning to Political Science majors and manages
the
Presenting Data website. Gary teaches "soft quantitative
analysis": descriptive statistics with very little use of
inferential statistics. His goal is for students to be able to "find,
interpret, and present statistical evidence in term papers, senior
theses and other research projects, and to be able to interpret multiple
regression analyses in published research articles." Gary is on
the leading edge of statistical literacy. Gary
Klass teaches
statistical reasoning to Political Science majors and manages
the
Presenting Data website. Gary teaches "soft quantitative
analysis": descriptive statistics with very little use of
inferential statistics. His goal is for students to be able to "find,
interpret, and present statistical evidence in term papers, senior
theses and other research projects, and to be able to interpret multiple
regression analyses in published research articles." Gary is on
the leading edge of statistical literacy. |
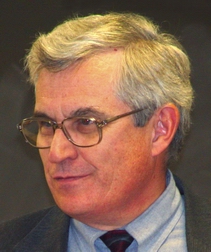
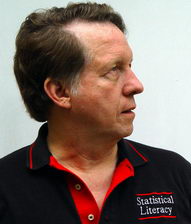
 Milo Schield
(above) and Tom Burnham (right) used a single statistic to summarize the
influence of a family of binary confounders and then generate the size
confounder needed to nullify an association. For background, see
previous papers
ASA 2002 and
ASA 2003.
A more controversial item is the introduction of 'confounder intervals.'
Session commentator Brian Jersky saw this as "an
innovative and unique scheme to assess confounding. " Milo Schield
(above) and Tom Burnham (right) used a single statistic to summarize the
influence of a family of binary confounders and then generate the size
confounder needed to nullify an association. For background, see
previous papers
ASA 2002 and
ASA 2003.
A more controversial item is the introduction of 'confounder intervals.'
Session commentator Brian Jersky saw this as "an
innovative and unique scheme to assess confounding. " |