Highlights 2011
-
StatLit.org matures: Index
views up 23%, page views up
18%. Visits down 2%, downloads off 5%. Around 28,000 home page
views, 122,000 page views, 170,000 visits
and 195,000 downloads. Google-ranked
#1 for "statistical literacy": 7th year. Also #2 and
#3. Wikipedia was #4. Schield at Augsburg ranked #5-#7.
Univ. of Wollongong ranked #8. Wired Magazine's
2010
article was #9.
|
|
|
|
|
|
|
***
Selected by the StatLit webmaster |
|
|
|
STATISTICAL LITERACY for DATA
PRODUCERS |
|
The Statistical Journal of the International Association of Official
Statistics (SJIAOS) Special Issue on Statistical Literacy 27 (2011)
Contents.
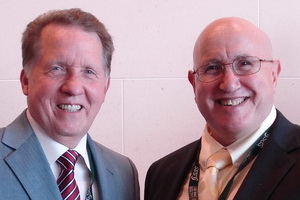
Editors: Jim Ridgway (left) and Neville Davies (right)
Editorial by S-M. Tam. "Special Issue on Statistical
Literacy" P. 95-97. |
Statistical
Literacy: A New Mission for Data Producers by Milo Schield (right).
P. 173-183. "If national statistical offices are to be more
effective in promoting evidence-based decision making that uses the data
they provide, they should consider extending their missions to include
“comprehensibility”: to provide accurate and timely data that is useful
to and comprehensible by users." |
- "How statistical literacy,
official statistics and self-directed learning shaped social enquiry
in the 19th and early 20th centuries" by Gillian Lancaster. P.
99-111. "In these [early] studies statistical literacy was
demonstrated as the ability to describe and communicate about
tabulated statistical information." "Statistical literacy is
crucial for understanding the world around us."
- "Official Statistics and statistical literacy:
They need each other" by Sharleen Forbes, Mike Camden, Nathaniel
Pihama, Paul Bucknall and Maxine Pfannkuch. P. 113-128.
- "The national statistical agency as educator" by
Mary Townsend. P. 129-136.
- "Statistical literacy and awareness as strategic
success factors of a national statistical office – the case of
Statistics Finland" by Reija Helenius and Heli Mikkelä. P.
137-144.
- "Creating statistically literate global citizens:
The use of IPUMS-International integrated census microdata in
teaching" by Ann Meier, Robert McCaa and David Lam. P 145-156.
|
- "The millennium development goals, national
statistical offices, the international statistical literacy project
and statistical literacy in schools" by Juana Sanchez, Sharleen
Forbes, Pedro Campos, Paola Giacche, Mary Townsend, Gai Mooney and
Reija Helenius. P. 157 -171.
- "Responding to diversity in users' statistical
literacy and information needs: Institutional and educational
implications" by Iddo Gal and Scott T. Murray. P. 185-195.
- "Foundations for improving statistical literacy"
by Jane M. Watson. P. 197-204.
- "Developments of AtSchool projects for improving
collaborative teaching and learning in statistics by Neville Davies.
P. 205-227.
- "Does CensusAtSchool develop statistical
literacy? by Iddo Gal. P. 229-230.
- Discussion by Chris J. Wild. 231-233.
- Rejoinder to Chris Wild and Iddo Gal's Comments by Neville
Davies P. 235-236.
|
|
STATISTICAL LITERACY
@ AUGSBURG |
|
Augsburg College
offered a new course: teacher training on Statistical Literacy. The
course (GST 200) was taught totally on-line in an accelerated six week
format in May and June. The course used Moodle exercises, Odysseys2sense
(tm) and the 2011 version of the
Statistical Literacy
textbook.
Syllabus. For more details, see
Teaching Teachers
Statistical Literacy Online. |
Michael Caulfield (left, instructional
designer) and seven other faculty from
Keene College NH completed
professional development in Augsburg's Statistical Literacy online. They
completed 730 problems, analyzed 14 news stories and gave weekly
feedback on the course. Their feedback resulted in the 2011 version of the
textbook. View Mike's
Tutoring at
Scale video.
Slides 1up |
OUTSTANDING JOURNAL ARTICLES |
  Test:
Frequency vs. % Test:
Frequency vs. %
Communicating Data About the Benefits and
Harms of Treatment by Steven Woloshin and Lisa Schwartz. Annals of
Internal Medicine; 7/19/2011, Vol. 155 Issue 2, p87-W33. Large
randomized trial. Conclusion: Natural frequencies are not the best
format... |
Significance testing as perverse
probabilistic reasoning M Brandon Westover, Kenneth D Westover,
Matt T Bianchi.
BMC Medicine 2011,
9:20 Given a test of statistical significance (P-value
<0.05) in favor of H1, subjects were asked, "What has been shown?"
Answers [%]. 1. H0 is false [4%]. 2. H1 is true [0%]. 3. H0 is
probably false [31%]. 4. H1 is probably true [20%]. 5. Both (1) and (2)
[3%]. 6. Both (3) and (4) [36%]. 7. None of the above [6%]. {A
must-read article. StatLit Editor.} |
|
NUMERACY
(NNN) JOURNAL |
Numeracy is an open-access, peer-reviewed
journal launched in 2008. Numeracy aims to support
education at all levels that integrates quantitative skills across
disciplines. The journal seeks evidence-based articles. See Vacher's
NECQL and
PKAL presentations. |
Len Vacher (left) and Dorothy Wallace (right)
are editors of Numeracy: Advancing Education in Quantitative
Literacy published by the National
Numeracy Network, supported by U. of S. Florida Libraries and hosted
by
the Berkeley Electronic Press™.
NNN listserv |
-
Reflections on the Tenth Anniversary of Mathematics
and Democracy Lynn Arthur Steen and
Bernard L. Madison
-
Personal and Professional Numeracy: A Unit for
Pre-Service Teachers at the University of Tasmania
by Jane M. Watson
-
Calculus, Biology and Medicine: A Case Study in
Quantitative Literacy for Science Students
by Kim Rheinlander and Dorothy Wallace
-
Spreadsheets Across the Curriculum, 2: Assessing Our
Success with Students at Eckerd College by
Laura Reiser Wetzel
-
Spreadsheets Across the Curriculum, 3: Finding a List
of Mathematical Skills for Quantitative Literacy Empirically
by H L. Vacher and Emily Lardner
-
Notes Go Figure: Calculus Students' Use of Figures
and Graphs in Technical Report Writing
Thomas J. Pfaff, Michael Rogers, Ali Erkan, and Jason G. Hamilton
- Book Reviews
Four
Popular Books on Consumer Debt: A Context for Quantitative Literacy.
Reviewed by Andrew J. Miller
-
Review of Sex, Drugs and Body Counts: The Politics of
Numbers in Global Crime and Conflict,
edited by Peter Andreas and Kelly M. Greenhill Aaron. Reviewed
by G. Montgomery
- Columns
Parts
of the Whole : Cognition, Schemas, and Quantitative Reasoning by
Dorothy Wallace
|
- Editorial:
A LEAP Forward for Quantitative Literacy
by H. L. Vacher
- Editorial:
A
Quantitative Literacy View of Natural Disasters and Nuclear
Facilities by C. B. Connor
-
Communicating Quantitative Literacy: An Examination
of Open-Ended Assessment Items in TIMSS, NALS, IALS, and PISA
by Karl Kosko and Jesse L. M. Wilkins
-
Development of an Assessment of Quantitative Literacy
for Miami University by Rose Marie Ward,
Monica Schneider, and James Kiper
-
Quantitative Literacy at Michigan State University,
1: Development and Initial Evaluation of the Assessment
by Alla Sikorskii, Vince Melfi, Dennis Gilliland, Jennifer Kaplan,
and Suzie Ahn
-
Quantitative Literacy at Michigan State University,
2: Connection to Financial Literacy by
Dennis Gilliland, Vince Melfi, Alla Sikorskii, Edward Corcoran, and
Eleanor Melfi
-
Constructivist and Behaviorist Approaches:
Development and Initial Evaluation of a Teaching Practice Scale for
Introductory Statistics at the College Level
by Rossi Hassad
-
Quantitative Reasoning in the Contemporary World, 3:
Assessing Student Learning by Stuart
Boersma, Caren Diefenderfer, Shannon Dingman, and Bernard Madison
- Perspectives:
Reducing Math Anxiety: Findings from Incorporating Service Learning
into a Quantitative Reasoning Course at Seattle University by
Allison Henrich and Kristi Lee
- Column:
Parts of the Whole: An Algebra Lesson by Dorothy Wallace
|
GRANTS FOR QR, QL and STATISTICS |
|
NSF
awards $600,000 to the City University of New York (CUNY) QR
Alliance for "Numeracy Infusion Course for Higher
Education (NICHE)." The goal is
"to increase the level of QR instruction and assessment in undergraduate
courses across a broad range of disciplines throughout the CUNY system." PI:
Esther Wilder (left)
Blog. Co-PIs: Dene Hurley and Frank Wang. Three-year grant
1121844. |
NSF
awards $2 million to a consortium for "LOCUS:
Levels of Conceptual Understanding in Statistics" Goal: "develop two instruments to assess conceptual
understanding of statistics ... aligned with Common Core State
Standards for mathematics." PI:
Tim Jacobbe
(left, U-FL). Co-PIs:
Robert delMas
(U-MN),
Bradley Hartlaub (Kenyon C) and Jeff Haberstroh (ETS). Four-yr
continuing grant
1118168 |
|
NSF
awards $400,000 to Loyola Marymount University (Los Angeles) for "Teacher
Education: Learning the Practice of Statistics." The goal
is to develop "research-based materials that enable [school] teachers to
facilitate students' progress toward statistical understanding." PI:
Anna Bargagliotti (right). Co-PIs: John Haddock, Celia Anderson and Mark
Conley. Two-year grant
1119016. |
NSF
awards $92,000 to Univ. of Minnesota and $92,000 to Ohio State U. for "Evaluation
and Assessment of Teaching and Learning About Statistics (e-ATLAS)."
The will allow statistical educators "to judge the effectiveness of its
past and on-going efforts." PI:
Joan Garfield (right, UMn); Dennis Pearl
(OSU). Co-PIs:
Robert delMas and Andrew Zieffler Two-year grants
1043141 and
1044812. |
|
NSF
awards $200,000 to Grinnell College for "A New Approach to
Teaching and Learning Statistics." Goal is to
develop, implement and evaluate "interactive Web-based games and ...
laboratory modules to effectively teach statistical thinking and
the process of scientific inquiry to undergraduate students." PI
Shonda Kuiper
(left). Co-PI
Rodney Sturdivant
(USMA). 3-year grant
1043814 |
NSF
awards $180,000 to University of California-Berkeley for "Learning
From the Scientist's Lab Book: Designing Interactive Dynamic Documents
for Teaching Statistical Thinking and Practice."
The goal is to transform "the statistics curriculum to foster the use of
statistical thinking to solve important scientific problems ." PI
Deborah Nolan. Two-year grant:
1043634 |
|
NSF awards mentioning these phrases by start-year (2011, 10, 09, 08, 07): numeracy (1,2,3,6,1), quantitative
reasoning (4,5,3,4,4), quantitative literacy (1,3,5,6,2), statistical
thinking (3,4,2,0,1), statistical
reasoning (1,2,0,0,0) and statistical literacy (0,0,0,0,0). NSF
database totals:
QR (20),
QL (19),
numeracy (14),
ST (10),
SR (5) and
SL (0). |
Vernier Grant to St. Josephs
for QL
Vernier Grant to St. Joseph's College (Indiana).
To to
enhance quantitative literacy through student-developed interactive
projects. (Sept 17). |
|
Teaching Statistics In School Mathematics |
|
Carmen Batanero (right),
Gail Burrill and Chris
Reading edit Teaching Statistics in
School Mathematics-Challenges for Teaching and Teacher Education: A
Joint ICMI/IASE Study.
Table
of Contents. Includes 37 articles on statistics education worldwide. |
 Developing
Statistical Literacy Developing
Statistical Literacy
Jim Ridgway (right), James Nicholson and
Sean McCusker authored "Developing Statistical Literacy in Students and
Teachers", Ch 10, in Teaching Statistics in School
Mathematics-Challenges for Teaching and Teacher Education. Discusses "what statistical literacy is, why
it is important" and "the need to keep pace with developments
worldwide." |
NEW PROFESSIONAL BOOKS |
|
Math for Life: Crucial Ideas You Didn't Learn in School by Jeffrey
Bennett 1st. "simply and clearly explains the key ideas of
quantitative reasoning". Applies them to everyday issues "most of
the mathematical skills needed for quantitative reasoning are fairly
basic, but the level of conceptual thinking can be quite advanced."
For more, see Jeff's
"Math for Life"
web page. |
Understanding The New Statistics: Effect Sizes,
Confidence Intervals, and Meta-Analysis by Geoff Cumming. "the
‘breakthrough’ text that finally shows how to analyze and interpret data
... without ...significance testing." "The
writing style is breezy and informal. The quality of scholarship
is excellent; the author is probably the top world expert on this
subject."
Interview |
|
Thinking,
Fast and Slow by Daniel Kahneman. A New York Times Top 10 Book
for 2011. One of The Economist’s 2011 Books of the Year. "Explains
the two systems that drive the way we think. System 1 is fast,
intuitive, and emotional; System 2 is slower, more deliberative, and
more logical." "exposes the extraordinary capabilities—and also the
faults and biases—of fast thinking..." |
Uneducated Guesses: Using Evidence to Uncover Misguided Education
Policies by Howard Wainer (Aug 28, 2011) "a must-read
for enthusiasts of evidence-based decision making and for those who make
public policy decisions without consulting the evidence." "a
refreshingly fact-based view of a complex problem"
Other Wainer books and articles. |
|
The Theory That Would Not Die: How Bayes' Rule Cracked
the Enigma Code, Hunted Down Russian Submarines, and Emerged Triumphant
from Two Centuries of Controversy by Sharon
Bertsch McGrayne. "McGrayne is such a good writer that she makes
this obscure battle gripping for the general reader." "Top holiday
reading." |
Thinking Statistically by Uri Bram. "we'll see why supposed
Casanovas might actually be examples of the Base Rate Fallacy; how to
use Bayes' Theorem to assess whether your partner is cheating on you;
and why you should never use Mark Zuckerberg as an example for anything.
See the world in a whole new light, and make better decisions and
judgements without ever going near a t-test." |
|
Targeted Learning: Causal Inference for Observational and
Experimental Data (Springer Series in Statistics) by
Mark J. van der
Laan (UC Berkeley) and Sherri Rose. "Demonstrates targeted learning in
epidemiological, medical, and genomic experimental and observational
studies that include informative dropout, missingness, time-dependent
confounding, and case-control sampling." |
"Targeted Learning, by Mark J. van der Laan (left) and Sherri Rose, fills a
much needed gap in statistical and causal inference. It protects us from
wasting computational, analytical, and data resources on irrelevant
aspects of a problem and teaches us how to focus on what is relevant –
answering questions that researchers truly care about." - Judea Pearl,
UCLA |
|
By Barbara Ann Wade. (Penn State)
"Knowing how important statistical literacy is, the purpose of this
research was to measure statistical literacy in adult learners before
and after they have completed a statistics class, or a research methods
class with no prior statistics, or a research methods class with prior
statistics. Based on
2009 thesis at
Penn State.
TOC |
By
Barbara Ann Wade "test results showed a statistically
significant difference among class types for the knowledge elements,
statistical thinking, reasoning, and literacy, but no statistically
significant differences for the critical questions" and "no significant
differences on the dispositional elements, affect, cognitive competence,
difficulty and value." |
|
The WSJ Guide to the 50 Economic Indicators That Really Matter: From Big
Macs to "Zombie Banks," the Indicators Smart Investors Watch to Beat the
Market. "Simon Constable and Robert E. Wright
offer investors powerful new tools to guide them through the markets.
Whether it's the VIX index (which tracks the level of anxiety among
investors) or the Vixen index ... " |
Handbook of Social Indicators and Quality of Life Research by Land,
Michalos, and Sirgy. Goal: "to create an
overview of the field of Quality of Life (QOL) studies in the early
years of the 21st century." Social indicators are statistical time
series “…used to monitor the social system, helping to identify changes
and to guide intervention to alter the course of social change." |
|
Hot Hand: The Statistics Behind Sports' Greatest Streaks by
Alan Reifman. Focuses on actual sports streaks, from the
famous—Joe DiMaggio getting at least one hit in fifty-six consecutive
games and the LA Lakers winning thirty-three straight games—to the less
well-known, such as the University of Dayton men’s basketball team going
0-for-24 on three-point shots. |
|
SELECTED SLIDES - POSTERS |
 Uncertainty:
Maths Teachers Uncertainty:
Maths Teachers
Getting Comfortable with Uncertainty: Maths Teachers and Statistics by
Gai Mooney, Education Services Unit, Australian Bureau of Statistics.
Conclusions: "Statistics is inductive! Context matters;
measurement matters and process matters." "Why should teachers
care? Develop healthy scepticism [in teachers and students]
without cynicism or niaivity"
Slides 6up.
22 August, 2011. |
 Statistical
Literacy for All Statistical
Literacy for All
Statistical literacy for all: teaching Critical
Thinking with Data by Sue Finch and Ian Gordon (Univ. Melbourne).
Includes "critical evaluation of statistical information and arguments."
"200 word assignments: critical evaluation of a data-based argument;
write a letter, email or commentary" “I have developed my capacity to
think about quantitative information” (81% agreed)
Poster |
 Responsible
Statistics
Slideshow Responsible
Statistics
Slideshow
Responsible Statistics: Using mathematics to shape public opinion by
Andrew Nelson (U. Illinois, Urbana). "Statistical Literacy: The
ability to make sense of statistics. [Statistical literacy]
Involves critical evaluation of data, graphs, percentages and sampling
techniques.
6up |
Responsible
Statistics
Slideshow (continue)
Importance: As important as literacy of written language.
[Involves]
Interpretation of descriptive statistics, scientific correlations,
quality of an argument • Ability to form one’s own opinion by knowing
how to correctly interpret data • Evaluate arguments and validity of
claims".
6up |
|
The Royal Statistical Society getstats Campaign Ten Years to
Statistical Literacy? By Neville Davies at
Statistics Canada. RSS activities: "The getstats campaign is about
giving everyone the skills and confidence to use numbers well." It
involves "rebranding statistics as a discipline," providing "a citizen's
charter for statistics" and "developing a course in statistical
awareness."
1up copy |
 Schield
Talks in 2011 Schield
Talks in 2011
Other talks by Milo Schield:
Statistical Literacy Worldwide: 2010. 1/6/2011 MAA JMM StatEd
6up.
Statistical Literacy: Confounding. University of
Texas, San Antonio 1/13/2011
6up.
Odysseys
Teach Critical Thinking. Poster, Augsburg College with Larry
Copes. 5/10/2011. Statistical
Literacy Teacher Training Online at NNN 10/14/2011
6up. |
NEW TEXTBOOKS |
|
Ethan Bolker (left) and Maura Mast have authored Common Sense:
Rethinking QR. Chapters: 1) Fermi problems, 2) units and unit
conversions, 3) % [change], 4) inflation, 5) averages, 6) distributions
[and graphs], 7) [linear functions], 8) [linear approximations], 9)
[exponential functions], 10) paying off debt, 11) probability, 12) [rare
events] and 13) [medical tests]. |
Ethan Bolker and Maura Mast (right) have authored Common Sense:
Rethinking QR. "What matters more is our wish to change the
way our students’ minds work – the way they approach a problem, or, more
generally, the way they approach the world. We hope that in ten years
our students will follow the news, confident in their ability to make
sense of the numbers they find there." |
|
Quantitative Literacy: Thinking Between the Lines by Bruce
Crauder, Benny Evans and Jerry Johnson. Topics include 1) critical
thinking, 2) analysis of growth, 3) Linear and exponential change, 4)
personal finance, 5) Probability, 6) statistics, 7) graph theory, 8)
voting and 9) geometry. Section 1.1: Public policy and
Simpson's paradox: Is "average" always average?
Freeman |
Why DO I have to Know Mathematics: You Don't-
But, That's the Problem by Rodney McNair. "If mathematics is
needed in college and in careers, then why would any college student
ever ask why mathematics is so important? Ah ha! Perhaps, it’s not the
students; maybe it’s the way we teach mathematics."
Math outside
the classroom. |
|
Answering Questions With Statistics by
Robert F. Szafran
at Austin State Univ (TX).
Uses General Social Survey data from 1980 and 2010. By
examining changes in subjective beliefs (such as abortion) and objective
characteristics (like marital status), students acquire a
broad knowledge of basic statistics and extensive experience with SPSS.
|
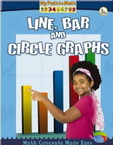
Line, Bar, and Circle Graphs by Claire Piddock (pb).
Percentage by Marsha Arvoy and Dorianne Nardi
(pb). My Path to Math series. Ages 6 and up. "Simplify math concepts with colorful
illustration and examples." Grades 2-3. |
|
The Numbers Guy |
 Carl
Bialik Carl
Bialik
Carl Bialik, the Wall Street Journal
"Numbers Guy," published 133 article-venues in 2011 [different
articles or same article in different venues], 106 in 2010, 63 in 2009, 24
in 2008, 11 in 2007 and 23 in 2006. He co-writes The Daily Fix, a sports column
that appears each weekday morning on WSJ.com. Carl has a degree in
mathematics and physics from Yale University.
WSJ blog. |
With Numbers, Context Can Be Everything
Abstract: California also measures its prison system by "operational
capacity," or the number of prisoners who can be housed given actual
conditions at prisons. Because of double-bunking, the state's
operational capacity is nearly twice its design capacity, and its
prisons were filled only 9% above operational capacity in 2009. Wall
Street Journal (Eastern edition). New York, N.Y.: Jun 18, 2011. p. A.2.
|
|
STATS |
 Trevor
Butterworth, editor of STATS, contributes to the
Financial Times, Forbes, and the Wall Street Journal. Trevor
Butterworth, editor of STATS, contributes to the
Financial Times, Forbes, and the Wall Street Journal.
ABC's Persecution Of Presidential Award-Winning Scientist Continues.
Pop a tab and pour a lie "white-hat bias: a tendency to
distort information to advance good causes "
More private liquor stores, more alcohol deaths? A.Norton
Top 50 statistics blogs of
2011. |
 Rebecca
Goldin, STATS Director of Research, is on the
Mathematics faculty at George Mason University. Rebecca
Goldin, STATS Director of Research, is on the
Mathematics faculty at George Mason University.
Brilliant ideas from the Washington Post: Learning math
is stupid! Goldin and Merrick.
High Wired: Does Addictive Internet Use Restructure the Brain?
STATS: We want people to
think about the numbers behind the news.
Stats essays for
2011. |
|
GENERAL NEWS |
|
Certificate of Official Statistics.
"Qualification designed to improve the statistical literacy skills of
state sector employees, especially policy analysts." "The goal of
this Certificate is to enable policy analysts to critically evaluate
statistics releases, research reports and published policy and media
documents for their appropriateness and quality ..."
Statistics New Zealand products, and their use in statistics education.
Brochure
Testimonials |
Grant Wiggins: Unlike the English standards, "the
mathematics components of the Common Core ... are a bitter
disappointment. In terms of their limited vision of math
education, the pedestrian framework chosen to organize the standards,
and the incoherent nature of the standards for mathematical practice in
particular, I don’t see how these take us forward in any way." |
|
UK Statistical Publications |
|
March:
How should we screen for breast cancer? by Howard Wainer.
Too much or too little scepticism? by Terry Speed.
June:
Sheconomics: Why more women on boards boosts company performance by
Karen Pine.
Sept:
Deming, data and observational studies by Young and Karr.
Dec.
Assessing long-term risk with short-term data by Howard Wainer.
|
Spring:
Distance Learning for Teacher Professional Development
in Statistics Education by Meletiou-Mavrotheris,
et al.
Summer:
When Should Zero be Included on a Scale Showing Magnitude? Marcin
Kozak.
Fall:
Cheating Partners, Conditional Probability and Contingency Tables.
Jane Watson |
|
QUOTES |
|
STATISTICAL LITERACY
-
"Statistical literacy is the ability to function
effectively in a world where evidence is available, but is not
certain. It involves understanding how to make decisions where
data are needed or produced: from deciding which mobile phone to buy
to evaluating the quality of new drug trials; from interpreting
survey results to critiquing government policy on social issues such
as health, crime, pensions and immigration"
Editorial SJIAOS 2011.
-
"Our visions is that 'statistical literacy' should be
seen within society as being a vital life skill."
RSS Education Vision
-
A society of statistically illiterate people is not a fully
democratic society. Barbara Ascari and Francesco Michele
Mortati (IASE)
-
"Statistical literacy is crucial for
understanding the world around us." "Statistical literacy
plays an important part in our every day lives, helping us to make
sense of and apply sound judgement to new ideas and discoveries that
can be oversensationalised by the media and press." G.A.
Lancaster How statistical literacy, official statistics and
self-directed learning shaped social enquiry in the 19th century.
SJIAOS 2011
-
"Statistical literacy involves products that use words, numbers and
graphs together to communicate messages. It includes skills in
making and using these products." By
Sharleen Forbes. et al.,Official Statistics and statistical
literacy: They need each other"
SJIAOS 2011
-
Some colleges have recently introduced course requirements in
financial literacy while others offer courses in statistical
literacy; both types of courses are clearly useful, but neither
covers the breadth of topics that we've covered in this book [Math
for Life], which means they are not by themselves enough.
Jeffrey Bennett:
Math for Life: Crucial Ideas You Didn't Learn in School
-
“Any claim coming from an
observational study is most likely to be wrong.” S. Stanley
Young, Alan Karr Significance Vol. 8 Iss. 3 (Sept 2011).
QUANTITATIVE LITERACY, etc.
-
Quantitative reasoning in today’s US society is no
luxury or elective; it is an essential. Dingman and Madison, Peer
Review Summer 2011 AAC&U
-
In math, what we need is “quantitative literacy,” the ability to
make quantitative connections whenever life requires (as when we are
confronted with conflicting medical test results but need to decide
whether to undergo a further procedure) and “mathematical modeling,”
the ability to move practically between everyday problems and
mathematical formulations (as when we decide whether it is better to
buy or lease a new car).
How to Fix Our Math Education By Sol Garfunkel and David Mumford
New York Times Aug 24, 2011.
Copy
NUMERACY
-
there can be no doubt that numeracy - which
includes the ability to understand, critique and use statistics and
statistical arguments - is as important today as literacy.
Petocz and Sowey,
Statistical Diversions in Teaching Statistics, Spring 2011,
p. 29-32.
-
Numeracy "is not a discipline but,
rather, a language crucial to most disciplines. The ability to adapt
mathematical ideas to new contexts in everyday life is the signature
of numeracy." "There are two paramount criteria for the
effective teaching of numeracy: 1) Development of conceptual
understanding. 2) Engagement in a critical analysis and
evaluation of how numbers affect our daily lives."
Teaching Numeracy: 9 critical Habits to Ignite Mathematical Thinking,
p. 2 and 4.
|
|
OTHER JOURNAL ARTICLES |
|
Statistical Literacy or Reasoning
A New Criterion for
Confounder Selection. Authors: VanderWeele, Tyler J.1 Shpitser,
Ilya2 Source: Biometrics; Dec2011, Vol. 67 Issue 4, p1406-1413.
Using plausible group sizes to communicate information
about medical risks. Authors:Garcia-Retamero, Galesic. Source:
Patient Education & Counseling; Aug2011, Vol. 84 Issue 2, p245-250, 6p
AP Statistics: Building
Bridges Between High School and College Statistics Education
by Christine Franklin. American Statistician, Aug2011, Vol. 65 Issue 3,
p177-182, 6p; DOI: 10.1198/tast.2011.09111
Professor's Page Statistical Literacy: Connectivity for the
Australian Curriculum. Watson, Jane Source:
Australian Primary Mathematics Classroom; Aug2011, Vol. 16 Issue 3,
p18-19.
When Should Zero be Included on a Scale Showing Magnitude? Marcin
Kozak. Significance Vol 33, Iss 22 (53–58) DOI:
10.1111/j.1467-9639.2010.00456
The problem of confounding in studies of the effect of maternal drug use
on pregnancy outcome by
Bengt Källén, MD, PhD Tornblad Institute.
Obstetric and Gynecology
International Volume 2012 (2012), Article ID 148616 |
Twenty-First-Century Quantitative Education: Beyond Content.
Shannon W. Dingman, assistant professor of mathematics, University of
Arkansas Bernard L. Madison, professor of mathematics, University of
Arkansas
Beyond math skills:
Measuring quantitative reasoning in context. By: Grawe, Nathan D..
New Directions for Institutional Research, Spring2011, Vol. 2011 Issue
149, p41-52, 12p; DOI: 10.1002/ir.379
Closing
the Loop: Involving Faculty in the Assessment of Scientific and
Quantitative Reasoning Skills of Biology Majors. Authors:
Hurney, Brown, Griscom, Kancler, Wigtil and Sundre. Source:
Journal of College Science Teaching; Jul/Aug2011, Vol. 40 Issue 6,
p18-23, 6p
By the numbers: it's a matter of quantitative literacy
to work toward equity in social justice issues. (spectrum)(Interview):
An article from: Diverse Issues in Higher Education."
Amazon 2011.
Low Health
Literacy Hema Padmanabhan Ann Intern Med December 6, 2011 155:794; |
|
Lessons from Inferentialism for Statistics Education
by Arthur Bakker and Jan Derry. Mathematical Thinking & Learning, 2011,
Vol. 13 Issue 1/2, p5-26. DOI: 10.1080/10986065.2011.538293.
The Reasoning Behind Informal Statistical Inference
by Makar, Bakker and Ben-Zvi. Mathematical Thinking & Learning, 2011,
Vol. 13 Issue 1/2, p152-173. DOI: 10.1080/10986065.2011.538301.
The Role of Context in Developing Reasoning about
Informal Statistical Inference by Makar and
Ben-Zvi. Mathematical Thinking & Learning, 2011, Vol. 13 Issue 1/2,
p1-4. DOI: 10.1080/10986065.2011.538291.
Missteps in Multiple Regression Student Projects: Beyond
Association-Not-Causation by Marlene Smith. American Statistician,
Aug2011, Vol. 65 Issue 3, p190-197, 8p; DOI: 10.1198/tast.2011.11075 |
Distance Learning for Teacher Professional Development
in Statistics Education by Maria
Meletiou-Mavrotheris, Efstathios Mavrotheris and Efi Paparistodemou.
Teaching Statistics, Spring2011, Vol. 33 Issue 1, p2-8, 7p; DOI:
10.1111/j.1467-9639.2010.00425.x
Rethinking Assessment of Student Learning in
Statistics Courses by Garfield, Zieffler,
Kaplan, Cobb, Chance and Holcomb. American Statistician, Feb2011, Vol.
65 Issue 1, p1-10; DOI: 10.1198/tast.2011.08241.
Teaching the Unthinkable in Introductory Statistics
by William Gratzer. Mathematics Teacher, Oct2011, Vol. 105 Issue
3, p230-234.
Special Issue on
Computer-Intensive
Methods with Emphasis on Bootstrap and Medical Research Applications
in the Journal of Biopharmaceutical Statistics; Nov/Dec2011,
Vol. 21 Issue 6. Articles: Travelogue—A Newcomer Encounters
Statistics and the Computer by Peter Bruce. p1158-1163. The
Bootstrap and Markov-Chain Monte Carlo by Bradley Efron. |
|
IASE
- Malahide Ireland |
|
Brian Phillips, James Nicholson and Milo Schield enjoying Ireland: home
of Guinness beer where William Gossett, the inventor of the t-test,
worked. Abstracts of all
conference papers. |
Italian Institute for Statistics (Istat):
Istat’s new strategies to
increase statistical literacy by
Barbara Ascari and Francesco Mortati (Italy).
IASE
See also
slides "What happens if non-overlapping universes collide?"
by Nicholson, Ridgway and McCusker. |
|
Andrew Garratt (RSS, Press and Public Affairs Manager) handles responses
to public inquiries and consultations, policy development (e.g., National
Statistics and Statistics and the law), developing and maintaining links
with external stakeholders and ... statistics users, and delivering
training on statistics in journalism and managing the awards for
statistical excellence in journalism. |
Milo Schield
presented Teaching the Social Construction of Statistics.
6up Joel
Best says all statistics are socially constructed. This paper investigates (1) Is Joel Best’s thesis true? (2) If so, should this
fact be taught? (3) If so, what general principles involving the social construction of statistics can be taught
that don’t rely on detailed knowledge?
ISI link |
|
Attitudes of Portuguese teachers towards
statistics: A qualitative analysis. By Martins, Nascimento and
Estrad. “I do not use statistics outside of school” 23%
neutral, 23% disagree and 54% agree. [Note that a majority of
these school teachers do not use statistics outside school.] "it
is crucial to include and highlight the statistical literacy in teaching
and training statistics with first cycle teachers." |
Outreach through Open Online Education. By Kay Lipson
(left) and Glenda Francis (right). OAU students: older, weaker
maths backgrounds and lower academic expectations. Yet "OUA Students
reported highest overall satisfaction of all faculties and second
highest student engagement." |
|
ISI-Dublin |
|
Milo Schield organized a session on Statistical Literacy, presented "Epidemiological
Models and Spotty Statistics"
6up, and was elected a member of the International Statistical
Institute (ISI). Milo (left) is shown with ASA Director: Ron Wasserstein
(right). |
Interpreting
Economic and Social Data by Othmar Winkler. "The more varied the
characteristics of the items included in that aggregate, the less
clearly defined will be the resulting pulp -- the statistical
aggregate." "The larger a statistical aggregate, ... the fewer
of the features of the socio-economic phenomenon remain
recognizable." An aggregate, a statistical figure alone cannot
be interpreted |
|
Statistical Literacy, Globalisation, and the Internet by
Jim Ridgway, James Nicholson
(left) and Sean McCusker. "the only plausible mechanism for improving
[statistical literacy] SL is to use the data sources themselves to
educate users. Statistical Literacy Heuristics: See that effect
size is bigger than measurement error. Focus on effect size
not significance level."
Slides 1up
|
 Holmes
and Schield Holmes
and Schield
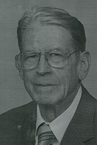
Milo Schield (right) consulted with Peter Holmes (left) in Sheffield
on various aspects of statistical literacy and statistical
education. |
|
ASA Journal of Statistical
Education (JSE) |
|
What
does the mean mean? by
Nicholas N. Watier,
Claude Lamontagne (right), and
Sylvain Chartier (University of Ottawa). Presents the
"socialist idea" (equal distribution) and the fulcrum or balance point
idea. See also
Lesser.(UTEP) who noted that "socialist" might be non egalitarian
while proposing the use of other explanatory ideas such as redistribution value,
fair share or "leveling" value. |
Using Interactive Graphics to Teach Multivariate Data Analysis to
Psychology Students by
Pedro M. Valero-Mora Universitat de València
(right, Spain) and Rubén D. Ledesma Universidad Nacional de Mar del Plata
(Argentina). How to present principle component analysis (PCA)
and factor analysis using graphical tools such as ViSta.
Download
ViSta. |
|
USCOTS |
|
2011
US Conference on Teaching Statistics (USCOTS): The Next Big Thing.
See Rob Gould's webinar:
Eat Less
Salt, Drink More Wine, Dump The Cellphone, Eat More Salt, And Live
Longer: Teaching Students To Understand The Role Of Data Collection In
Statistical Inference.
6up |
Slides for
It Takes a
Village: Future Directions for Statistics Education Research by Bob
delMas, University of Minnesota.
Marc Isaacson presented a activity:
Olympic Success. Milo
Schield presented an activity:
Hypothetical Thinking. |
|
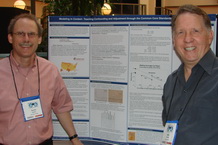
Daniel Kaplan (Macalester) and Milo Schield (Augsburg) presented a
poster: Modelling in
Context: Teaching Confounding and Adjustment through the Common
Core Standards. |
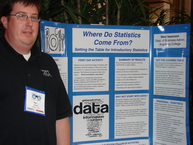
Marc Isaacson presented
"Where Do
Statistics Come From?" "To say “Statistics Come from
Data” is similar to saying “Babies Come from Hospitals”. While it is
generally true and an appropriate answer for some audiences, it leaves
out a whole lot of the interesting part of the story." |
|
ASA JSM: Late-Breaking Session |
 US
Supreme Court US
Supreme Court
Milo Schield (Augsburg) organized and
chaired an invited late-breaking session:
Supreme Court Finds Statistical Significance Not Necessary for
Causation. 6up
150 attended. |
Daniel T. Kaplan (right Macalester
College) presented Comments on US Supreme Court Matrixx Case: Is
Significance Significant?" Discussed whether the "topics
covered in university-level statistics education is oriented toward
supporting quantitatively-sophisticated, effective decision-making in
the civic domain."
Abstract
1up |
 Statistical
Significance on Trial Statistical
Significance on Trial
Stephen Ziliak (Roosevelt U.) presented
Matrixx v. Siracusano and Student v. Fisher: Statistical Significance on
Trial.
Abstract.
1up Note: this
talk was based on a related paper in Significance magazine. |
Jay Kadane (left) presented "The
tenuous relationship between tests of significance and causation:
Matrixx and the Supreme Court."
Abstract. Donald Rubin (right) commented.
Abstract.
|
|
ASA: Statistical Literacy #14 |
 Statistical
Literacy #14 Statistical
Literacy #14
Milo Schield (Augsburg)
organized and
chaired the 14th
annual
topic-contributed session "Statistical Literacy: 2011" with
50-60 attendees in Miami, FL. Milo also presented
Describing Quantitative Relationships
Using Informal Grammar in a contributed session.
6up
1up WB1
WB2 |
Kaiser
Fung (New York Univ.), author of
Numbers Rule Your World, presented
Pop-Stats Books and
Statistical Education. "Recently, pop-stats books have
captured the public's favor, overcoming the negative perception of the
subject of statistics." "What can educators learn from this
publishing phenomenon? What is the role of pop-stats books in statistics
courses?
Abstract. 1up. |
|
Joseph Ganem (Loyla University, Maryland), author of The Two-Headed
Quarter, presented Integrating Quantitative and Financial Literacy.
"This paper proposes that financial literacy be integrated into the
current math curriculum rather than taught separately because it is an
ideal subject for teaching quantitative reasoning."
Abstract. 6up |
Herbert Weisberg (Correlation Research, Inc.) presented
Statistics
and Causation: Past, Present, and Future. "The rationale for
large-scale randomized clinical trials so predominates today that
essential limitations of this gold standard are rarely considered."
"New realities imply the need to reconsider the ways in which these
studies should be designed and analyzed in the future."
Abstract
1up |
|
David and Phyliss Whitin (Wayne State
University) presented Learning to Read the Numbers: Critical
Literacy and Numeracy in K-8 Classrooms.
1up.
"The presenters developed a
heuristic that provides questions to guide learners in interrogating
data-related texts.
Abstract |
Ernine Orta (right) and Nandini Kannan (Univ.Texas San Antonio)
presented Assessing QR: What do Freshman Know? UTSA tests
freshman on "knowledge of simple probability, interpreting data
summaries and interpreting graphs. Comparisons by gender and ethnicity
will be discussed."
Abstract 6up |
|
ASA JSM 2011 |
|
T. Paulette Ceesay (Merck & Co.) presented Teaching Statistics
Using the News Media. Uses "news media to teach statistics;
undergraduate students at a large urban university are the audience.
However, this approach would also benefit secondary school students...
The rewards and challenges of this approach will be discussed as well as
students' reactions.
Abstract 6up SL |
Larry Lesser (Univ. Texas, El Paso) presented
Making Statistics Memorable: New Mnemonics and Motivations. "Mnemonics
(memory aids) have the potential to decrease anxiety and increase
recall. They may also serve as triggers for thinking routines (e.g.,
Pfannkuch, 2010) and increase cognitive resources available for more
conceptual thinking..."
Abstract |
|
How Do We
Promote Clinical Statistics Literacy of Emergency Medicine
Residents: Is Clicker Technology the Answer? by
Penny Reynolds
(Virginia Commonwealth) "Clickers were useful in increasing
immediate engagement and participation, but did not reinforce or
encourage learning outside of the sessions." "Understanding of risk
increased from 25% to 70%."
6up slides |
 Teach
Stats to Diverse Students Teach
Stats to Diverse Students
Teaching Statistics to Culturally and Linguistically Diverse Students
by
Amy Wagler
(right) and Larry Lesser (Univ. of Texas El Paso). "strategies that help
English language learners (ELL) usually help all students because Lesser
and Winsor (2009) discuss research that indicates that students of all
levels of English proficiency struggle with academic language used in
statistics courses." |
|
Including Student Ability
to Assess Learning with Other Assessment Tools by Zachariah Dietz,
John Lovell (left) and Julia Norton. On their final, students
rated their ability [confidence] to answer 20 selected questions.
Correlations between confidence and competence are investigated for
various types of problems and mental activities.
|
Robert Carver (Stonehill,
Brandeis) presented "It May Be a
Great Day for Baseball, but Is It a Great Day for a Knuckleball?"
"The pitch is notoriously difficult to control, but when effective its
slow speed and wide arc leaves batters extremely frustrated."
Examines influences. 6up
"The analysis is accessible to undergraduate students, illustrating the
managerial utility of multivariate models" |
Communicating
Health Data
Making Data Talk: Communicating Health Data with Lay Audiences by
David Nelson, Brad Hesse and Harry Kwon. This presentation provides
"practical suggestions on how statisticians can better communicate data
to lay audiences." Introduces "the OPT-In (Organize, Plan, Test,
Integrate) framework [to help] with communication, planning and decision
making."
Abstract 6up. QL Permission requested |
Teaching Introductory Statistics and Study Design to Residents in a
Teaching Hospital by Lori Lyn Price, Jessica Paulus, and John Griffith
(Tufts Clinical and Translational Science Institute). "Engaging the full
set of participants is difficult, as many residents are required to
attend regardless of their interest in the content."
Seminar topics. |
 Discuss
Stat Concepts Online Discuss
Stat Concepts Online
Virtual Discussion for Real Understanding by
Kendra K. Schmid
(Nebraska Medical Center). "This paper focuses on fostering “discussion”
about statistical concepts and how they relate to each student on an
individual level. The approach includes an online discussion board where
students participate in guided questions and post and critique an
article related to their field of study" |
Spatial
Context in Intro Stats
Ignoring the Spatial Context in Intro Stats Classes – And Some Simple
Graphical Remedies by Nathan Voge and Jűrgen
Symanzik (Utah State). "most introductory statistics books do not
even suggest that ... data often are ... effected by ... spatial
association." We show how some of the data used in [textbook] examples
and exercises can be initially displayed via various map views.
Permission Requested: |
|
ASA: Statistical Literacy International |
|
Reija Helenius (left, Statistics Finland and co-director of the
International Statistical Literacy Project) organized an invited
session: Improving Statistical Literacy by International
Cooperation. Chair: Sonya Vartivarian (Government
Accountability Office). Milo Schield (W. M. Keck Statistical
Literacy Project of Augsburg College) was the discussant.
6up |
Gillian Lancaster (Lancaster University, England) presented
Strategies for Stimulating Statistical Literacy and Understanding
Quantitative Evidence in Higher Education in the UK. "This
paper gives examples of some of the teaching strategies and
networking initiatives undertaken by the Postgraduate Statistics
Centre, Lancaster University."
Abstract 6up |
|
Mary Townsend (Statistics Canada) presented Three global
initiatives to further statistical literacy. Abstract 6up |
Roxy Peck (California Polytechnic State University) presented
Statistical Literacy and the Common Core Curriculum in the United
States. "Will teachers be prepared and ready to teach to the
challenging conceptual content? Will materials be available to
teachers to support instruction? Is "statistical literacy for all"
achievable or just a pipe dream?
Abstract 6up |
|
|
 Rethinking
Social Epidemiology Rethinking
Social Epidemiology
Rethinking Social Epidemiology: Towards a Science of Change.
Editors:Patricia O'Campo and James R. Dunn. "provides an expanded vision
of social epidemiology as a science of change." Addresses "the
causes of social inequalities in health (problem-focused research) [and]
the implementation of interventions to alleviate ... marginalization and
poverty (solution-focused research)" |
 Causality
in the Sciences Causality
in the Sciences
Causality in the Sciences by Phyllis McKay Illari, Federica Russo
and Jon Williamson. "There is a need for integrated thinking about
causality, probability and mechanisms in scientific methodology.
Causality and probability are long-established central concepts in the
sciences:" "a panoply of disciplines, ranging from epidemiology to
biology, from econometrics to physics." |
NEW BOOKS: PSYCHOLOGY, SOCIAL STATISTICS |
|
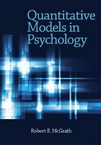
Quantitative Models in Psychology by Robert McGrath (Fairleigh
Dickinson University). "Using the organizing principle that
quantitative methods are the building blocks of models, this book
focuses on models of inference, models of measurement, and the modeling
of psychological phenomena." "covers everything needed at the
graduate level and beyond." |
 Quantitative
Ecologist Quantitative
Ecologist
How to be a Quantitative Ecologist by Jason Matthiopoulos
(University of St Andrews, Scotland). "slowly but surely instils an
understanding of mathematics, statistics and programming, sufficient for
initiating research in ecology. ... enhanced by extensive
use of biological examples and the computer language R for graphics,
programming and data analysis." |
 Quantitative
Criminology Quantitative
Criminology
Handbook of Quantitative Criminology. Edited by Alex Piquero and
David Weisburd; Published by the APA. "Key areas: (1) research
design, (2) experimental methods, (3) methods for overcoming data
limitations, (4) innovative descriptive methods, (5) estimation
techniques for theory and policy, (6) topics in multiple regression, and
(7) new directions in statistical analysis." |
 Association
Graph: LogLinear Association
Graph: LogLinear
The Association Graph and the Multigraph for Loglinear Models by
Harry Khamis (Wright State University). For students studying "the
analysis of categorical data, to develop the ability to evaluate and
unravel even the most complex loglinear models without heavy
calculations or statistical software." Sage Publ. |
|
Understanding Quantitative History by Loren Haskins and Kirk
Jeffrey. "first text in statistics and quantitative methods for history
students and other liberal arts students, which explains and applies
modern methods of quantitative analysis to history. A title in the New
Liberal Arts series, co-published with the MIT Press and sponsored by
the Alfred P. Sloan Foundation." |
 Understanding
Educational Stats Understanding
Educational Stats
Understanding Educational Statistics Using Microsoft Excel and SPSS
by Martin Lee Abbott. "presents the essential
statistical procedures for drawing valuable results from data in the
social sciences." Topics: "Single-sample tests, Repeated measure tests,
ANOVA [one way and factorial], Independent t-tests, Chi square,
Correlation, Bivariate regression and Multiple regression." |
NEW BOOKS: EDUCATION |
|
Visible Learning for Teachers: Maximizing impact on learning by
John Hattie. "Written for students, pre-service and in-service teachers,
it explains how to apply the principles of Visible Learning to any
classroom anywhere in the world." Offers "concise summaries of
successful interventions and implementation" of the principles from
Visible Learning (2009). ." |
 Teaching
Fractions Teaching
Fractions
Strategies for Teaching Fractions: Using Error Analysis for Intervention
and Assessment by David B. Spangler (pb). "David B. Spangler
outlines powerful diagnostic and NCTM- and Common Core State
Standards-aligned RTI strategies for analyzing student errors and
provides specific interventions for each error pattern."
|
NEW BOOKS: NUMERACY |
|
By Margie Pearse and Kate Walton. Teaching Numeracy: 9 Critical
Habits to Ignite Mathematical Thinking. Habit 3:
identify similarities and differences, recognize patterns, organize and
categorize ideas, investigate analogies and metaphors. Habit 4: Represent mathematics non-linguistically. Habit 5: Predict, infer, recognize trends, use patterns, and generate
and test hypothesis. 4/2011 |
 Building
Numeracy Building
Numeracy
Building Powerful Numeracy for Middle and High School Students by
Pamela Weber Harris. Two big ideas: 1) Teach the importance of
representation... such as the open number line, the open array, and the
ratio table. 2) Teach with problem strings: purposefully designed
sequences of related problems that help students construct numerical
relationships. 8/2011 |
NEW BOOKS: DATA |
 Visualize
This: Flowing Data Visualize
This: Flowing Data
Visualize This: The FlowingData Guide to Design, Visualization, and
Statistics by Nathan Yau. "Offers step-by-step tutorials and
practical design tips for creating statistical graphics, geographical
maps, and information design to find meaning in the numbers"
"Nathan Yau is a PhD candidate in Statistics at UCLA and a lifelong data
junkie." |
 Looking
at Data Looking
at Data
Beautiful Visualization: Looking at Data through the Eyes of Experts.
Edited by Julie Steele and Noah Iliinsky. "Successful
visualizations are beautiful ... for elegant layers of detail that
efficiently generate insight and new understanding." "examines the methods of two dozen visualization experts. Together they
demonstrate how visualization can help us make sense of the world."
|
|
Big data: The next frontier for innovation, competition, and
productivity [Paperback] by James Manyika and Michael Chui
(McKinsey Global). "Big data will help to create new growth
opportunities and entirely new categories of companies. Many will be
companies that sit in the middle of large information flows where data
... can be captured and analyzed." |
 Data
Dynamite Data
Dynamite
Data Dynamite by W. David Stephenson "... gives us a preview of
what life will be like when data is available to all who need it and
organizations become data-centric." "free, real-time data really is
'dynamite,' just waiting for us to show the vision and determination to
make it available." "new data visualization tools that help
transform the data into critical knowledge...." |
 Numbers:
Data for Teachers Numbers:
Data for Teachers
Beyond the Numbers: Making Data Work for Teachers & School Leaders
pb. by Stephen White 2nd ed. Helps teachers and school leaders
make wise decisions with imperfect data. Uses "proven, established
components delineated in each chapter. New topics covered include Common
Core Sate Standards... and new assessment systems designed to improve
instruction..." |
 Fluencies
for the Digital Age Fluencies
for the Digital Age
Literacy Is NOT Enough: 21st Century Fluencies for the Digital Age.
By Lee Crockett, Ian Jukes and Andrew Churches. "To be a global digital
citizen, one must be fluent in collaboration, media and information so
that one can be fluent in creativity and solutions. includes sample
lessons: grade 4 science, grade 6 mathematics, grade 8 social studies
and grade 10 language arts." |
NEW EDITIONS |
|
Brase and Brace: "Much of statistical literacy is
the ability to communicate concepts effectively." This text book
"ensures that the student knows what is being covered at every step
along the way to statistical literacy." 10th ed. |
 Teaching
Fractions & Ratios 3rd Teaching
Fractions & Ratios 3rd
Teaching Fractions and Ratios for Understanding: Essential Content
Knowledge and Instructional Strategies for Teachers 3rd ed. by Susan
J. Lamon. "helps teachers build the comfort and confidence they need to
begin talking to children about fractions and ratios." "clear
distillation of complex ideas and the translation of research into
usable ideas for the classroom." 10/2011 |
 Guide
to Numeracy: 2nd Ed Guide
to Numeracy: 2nd Ed
Chambers Adult Learners' Guide to Numeracy by Geoff Mainwaring.
aimed at adults who lack confidence in their numeracy skills. "The
two-color text is clearly and spaciously laid out, and plentiful
examples, diagrams, and exercises reinforce all the learning points." "based around the "Skills for Life" numeracy curriculum created
by the Department for Education and Skills." 4/2011 |
 Intro
to Stats & Data Analysis Intro
to Stats & Data Analysis
Introduction to Statistics and Data Analysis 4th ed. [Hardcover]
By Roxy Peck, Chris Olsen and Jay L. Devore. "introduces you to the
study of statistics and data analysis by using real data and
attention-grabbing examples." |
PEOPLE |
|
Joel Best and Milo Schield met (12/27) and
reviewed why quantitative educators were so unwilling to fully accept
Joel's claim that all statistics are socially constructed. As one
statistical educator noted, "This might bring our discipline into
disrepute." |
Schield not Promoted at NNN
As the Vice President of the National Numeracy
Network (NNN), Milo was the presumptive candidate to become the
President. But after giving his paper,
Teaching Statistical Literacy Online,
and stressing the importance of context and critical thinking in
teaching statistical literacy (6up),
an alternate candidate was proposed and elected by the NNN Board of
Directors (Oct 15). In a related development, Schield was
nominated, but not elected, as head of the Statistical Education SIG of
the MAA. |
-
2011 Nov 6:
Ireland's
John Hooper Medal for Statistics.
Comments by Minister for Research and Innovation, Seán Sherlock T.D.
"Statistics lie at the heart of the type of quantitative reasoning
necessary for making important advances in the sciences, such as
medicine and genetics, and for making important decisions in
business and public policy, and indeed in our daily lives. "The
study of Statistics is not just an essential part of one’s formal
mathematical education but is an important part of what it means to
be numerate."
-
2011 Nov 1.
Math for Life: Crucial Ideas You Didn't Learn in School by
Jeffrey Bennett. How can we solve the national debt crisis? Should you or your
child take on a student loan? Is it safe to talk on a cell
phone while driving? Are there viable energy alternatives to
fossil fuels? What could you do with a billion dollars? Could simple
policy changes reduce political polarization? These questions may
all seem very different, but they share two things in common. First,
they are all questions with important implications for either
personal success or our success as a nation. Second, they all
concern topics that we can fully understand only with the aid of
clear quantitative or mathematical thinking. In other words, they
are topics for which we need math for life—a kind of math that looks
quite different from most of the math that we learn in school, but
that is just as (and often more) important. In Math for Life,
award-winning author Jeffrey Bennett simply and clearly explains the
key ideas of quantitative reasoning and applies them to all the
above questions and many more. He also uses these questions to
analyze our current education system, identifying both shortfalls in
the teaching of mathematics and solutions for our educational
future. No matter what your own level of mathematical ability, and
no matter whether you approach the book as an educator, student, or
interested adult, you are sure to find something new and
thought-provoking in Math for Life. -
2011 Oct 24:
QR Faculty
Positions. University Scholars Programme, National University of
Singapore. The three appointees will form the core of a team
with the task of developing QR as a required part of the foundations
of USP's curriculum. We are aiming for rigorous and intellectually
sophisticated courses, which focus more on quantitative approaches
in critical thinking than on the mathematical tools themselves.
Classes will be themed around a topic developed by the instructor,
but with common QR components across all courses.
QR-Foundation draft
template.
Further questions about the position should be directed to Professor
John Richardson, Director, USP at uspbox24@nus.edu.sg
-
2011 Oct 23.
Innumeracy by Alan Penman in Significance.
I’m concerned about public “Innumeracy”, also known
as “Quantitative Illiteracy”, a condition that affects millions of
adults on both sides of the Atlantic, according to recent surveys.
About 22% of the American population scored at the lowest levels of
quantitative literacy, according to the U.S. Department of
Education’s Adult Literacy Survey. In the UK, the Vorderman Task
Force reported that 24% of working adults are "Functionally
Innumerate". These days we are deluged with data, but we don’t seem
to have the right mental equipment to make sense of it all. We are,
literally, drowning in numbers. Is the condition treatable? I’m not
sure - humans have an innate number sense, but this is approximate
and limited and just may not be capable of handling such large
quantities. Nevertheless, we can surely do a better educational job
than we are now. “Quantitative Literacy”, which is even more
fundamental than mathematical or statistical literacy, has several
components, but key ones are the ability to interpret data and draw
correct inferences. Shouldn’t we make this a basic and integral part
of our education curriculum, beginning in first grade?
-
2011 Oct 6, Tobias Bucknell.
Statistical Literacy thoughts.
Comment on Pinker's comment (Oct 4). "Education is an
antidote. Statistical literacy is a must." -
2011 Oct 4, Steven Pinker "One necessity is greater statistical literacy among the population
and especially among journalists. People need to think in terms of
proportions rather than salient examples, to appreciate orders of
magnitudes (ten thousand deaths versus ten million deaths), to
distinguish random blips from systematic trends, and to be aware
of—and thereby discount—their own cognitive biases. When Harvard
revamped its undergraduate curriculum a few years ago, I lobbied
(unsuccessfully) for a statistical and analytic thinking
requirement."
Freakonomics Blog -
2011 Oct 1, David Broussoud,
Quantitative Literacy vs. Mathematics.
"A
QL requirement should be independent of a mathematics requirement.
If your students need algebra, QL should not replace that. In the
other direction, algebra is not a substitute for QL. The
mathematical and statistical skills needed for QL are basic. Algebra
need not be a pre-requisite. What makes this college-level material
is that these skills are applied and interpreted in messy,
real-world situations, using quantitative approaches to aid analysis
of complex social issues. In many respects, the natural home for QL
is in the social sciences, but I believe that math and stat
departments have an important role to play in keeping the
mathematics of QL honest and encouraging quantitative thinking as
one of the important tools for studying social issues." "I am
suspicious of any program that claims to be QL but is taught
exclusively by mathematicians. I also should add that Macalester has
no mathematics requirement for graduation, but it does have a QL
requirement. I heartily endorse this choice. I do not see a need for
all students to study college-level mathematics, but I do see a need
for improving their ability to apply quantitative reasoning."
MAA Launchings -
2011 Oct 3. Ian Thorpe
"Basic statistical literacy is not actually that hard. It’s not
difficult to learn how to understand fractions and ratios and how to
read data tables or understand graphs and charts, or how to use them
effectively (and honestly) in communicating statistical data – if
more effort was placed on teaching them and they were more valued.
And just this basic understanding could help avoid many incorrect
interpretations of data and the faulty decisions which emanate from
them."
Blog -
2011 Aug: Statistical Literacy,
Globalisation, and the Internet by Ridgway, Nicholson and McCusker at the 2011 World Conference of the
ISI. "Every interesting problem in health, crime, poverty,
environment, education, personal well being is multivariate, has
non-linear relationships [and] has confounding variables."
"You have to be able to DESCRIBE the phenomena before you begin.
DESCRIPTION brings you face to face with big statistical ideas
–quality of data, study design, measurement error, interaction,
effect size." "Statistical Literacy 2011 is awareness of the
‘politics of data’: the choice of measures reflects values and
philosophies; [the] Aesthetics of measurement." "We are going
to be redefining ‘statistical literacy’ for rather a long time." -
2011 June 27: "one
of our objectives as Stats SA is to stimulate interest towards
statistical literacy". Pali Lehohla is South Africa’s Statistician-General and head
of Statistics South Africa.
-
2011 June 7: "Creating
statistically literate global citizens: The use of IPUMS-International
integrated census microdata in teaching." By
Meier, A., R. McCaa, and
David Lam.
Statistical Journal of the IAOS: Journal of the International
Association for Official Statistics, 27(3): 145-156. "This paper
illustrates two approaches to using IPUMS-I census microdata in the
university curriculum to promote statistical literacy among
undergraduates."-
2011 May 26: Dyscalculia: as common as
Dyslexia but more of a life handicap.
Story.
-
2011 April 19:
Tangled Webs: How False Statements are Undermining America: From
Martha Stewart to Bernie Madoff by John Stewart.
A Teaching Moment on Numeracy by Freakonomics (7/19) who say
that the
first statistic in John Stewart's book is wrong. -
2011 April 8:
Tackling the challenge of poor numeracy skills.
UK Office for Standards in Education,
Children's Services and Skills (Ofsted).
Report. "The importance of literacy as a precondition of
learning and progress at work is widely understood. The challenge is
in giving numeracy the same status, so that learners, providers,
tutors and employers all see numeracy as essential to achieving
vocational qualifications and career and personal goals."
"literacy, communication skills, numeracy and enthusiasm are the
most important employability skills ..., and a lack of them in a
candidate is a “deal-breaker” for many employers." See also the 1999 UK Moser report,
A fresh
start – improving literacy and numeracy, and the 2011 UK NIACE
inquiry on adult numeracy,
Numeracy
Counts.
-
2011 April:
Towards more accessible conceptions of statistical inference
C. J. Wild, M. Pfannkuch1, M. Regan, N. J. Horton. "if the
goal is to introduce the idea of statistical inference to
statistical beginners without the use of computational aids and with
minimal mathematics, then arguably this paper represents the single
biggest advance in several decades of concerted effort in
statistical education." Milo Schield
-
2011 March 31:
Statistical literacy is a great asset:
Kalam (Former President of India) laying the foundation stone for
Sankhya -- the National Museum of Statistics at the University of
Hyderabad.
-
2011 March 28:
Teaching Statistics - Early View
Going Beyond the Book: Towards Critical Reading in Statistics
Teaching by Andrew Gelman.
Using Pictures to Enhance Students' Understanding of Bayes' Theorem
by David Trafimow.
Cheating Partners, Conditional Probability and Contingency Tables
by Jane M. Watson.
-
2011 March 22:
US Supreme Court rules against requiring statistical significance.
Justice Sonia Sotomayor, writing for the court
on Tuesday, roundly rejected Matrixx’s proposal that information can
be material only if it meets standards of statistical significance.
“Given that medical professionals and regulators [FDA] act on the
basis of evidence of causation that is not statistically
significant,” she wrote, “it stands to reason that in certain cases
reasonable investors would as well.”
Supreme Court Docket
Matrixx Petition
Respondents' Brief
Matrixx Reply Brief
Supreme Court Opinion.
Amicus briefs:
Economists Litan and Mason,
McCloskey-Ziliak. McCloskey-Ziliak
crusade.
-
2011 March 15:
USDA, FFA HELP STUDENTS CONNECT AGRICULTURE TO REAL LIFE EXPERIENCE.
Classroom-Ready Curricula Linking Agriculture
to Science, Math and Social Studies Available Published: Tuesday,
March 15, 2011 5:14 PM CDT WASHINGTON, March 14, 2011 – In
celebration of National Ag Day on March 15, the U.S. Department of
Agriculture’s National Agricultural Statistics Service (NASS) and
the National FFA organization announce the availability of
classroom-ready resources aligned with national curricula standards
for science, math and social studies. These educational tools use
the 2007 Census of Agriculture to promote communication skills,
math, and statistical literacy among kindergarten through 12th grade
students.
-
2011 March:
Contest -- QL in the
Media (Best and Worst).
SIGMAA-QL. Deadline 12/1/2011. Winners announced at 2012 JMM. -
2011 March:
Data Pointed:
Fascinating data visualization
research blog site by Stephen Von Worley.
-
2011 March:
Neil
Lutsky Recipient Amer. Psychological Foundation's "Distinguished
Teaching of Psychology Award."
This award recognizes "a significant
career of contributions as an exceptional teacher of psychology."
Lutsky was nominated for this recognition by a group of his former
students at Carleton and by colleagues in the psychology teaching
community.
-
2011 Feb 15: Johns Hopkins offers
Statistical Literacy and Reasoning in Nursing Research.
NR110.507.
-
2011 Feb 7:
Social Psychologist Sees Bias Within. New York Times
Understanding current causes of women's underrepresentation in
science Stephen J. Ceci and Wendy M. Williams.
Understanding
a new study about discrimination. By Alison Gopnik Slate.
-
2011 Jan 25:
Low expectations and other forms of bigotry. The Economist.
The decision to publish revised school league
tables showing how many pupils achieved a reasonable pass in five
core subjects (English, maths, a foreign language, a science subject
and either history or geography) exposed how many schools were
boosting their scores by pushing pupils into soft, often vocational
subjects which counted for as much as a pass in chemistry, French or
history.
-
2011 Jan:
QL and Democracy +10:
MAA President David Bressoud marks the 10th anniversary of the
publication of Mathematics and Democracy: The Case for
Quantitative Literacy in his January 2011 Launchings column.
"Quantitative literacy is "the power and habit of mind to search out
quantitative information, critique it, reflect on it, and apply it
in [one’s] public, personal, and professional life" [2]. The
mathematics can be very simple. It is the ability to work in context
that makes this a demanding discipline, and, for quantitative
literacy, context is everything. The goal is to empower students to
reason with the complex quantitative information that is omnipresent
in today’s world."
-
2011
Dec 3.
Citizen science makes statistical literacy critical.
Simply Statistics blog. "It strikes me that statistical
literacy is critical if the citizen science movement is going to go
forward. Ideas like experimental design, randomization, blinding,
placebos, and sample size need to be in the toolbox of any
practicing citizen scientist. One major drawback is that there
are very few places where the general public can learn about
statistics. Mostly statistics is taught in university courses.
Resources like the Kahn Academy and the Cartoon Guide to Statistics
exist, but are only really useful if you are self motivated and have
some idea of math/statistics to begin with. Since
knowledge of basic statistical concepts is quickly becoming
indispensable for citizen science or even basic life choices like
deciding on healthcare options, do we need “adult statistical
literacy courses”? These courses could focus on the basics of
experimental design and how to understand results in stories about
science in the popular press. It feels like it might be time to add
a basic understanding of statistics and data to
reading/writing/arithmetic as critical life skills. I’m not the only
one who thinks so."-
2011 Nov
1. Math for Life by
Jeffrey Bennett.
"Focus on quantitative reasoning .. to fulfill the college
math requirement. Because quantitative reasoning is so
important to modern life, it is a great disservice to make the
requirement anything else. Some colleges have recently
introduced course requirements in financial literacy while others
offer courses in statistical literacy; both types of courses are
clearly useful, but neither covers the breadth of topics that we've
covered in this book, which means they are not by themselves enough.
(Note, however, that such courses can be great options for one
semester of a two-semester quantitative reasoning requirement.)"
-
2011
October 29.
The 5 Most Critical Statistical Concepts
[Skills for a
statistician].
By Simply Statistics blog. "(A) The ability to
manipulate/organize/work with data on computers - whether it is with
excel, R, SAS, or Stata, to be a statistician you have to be able to
work with data. (B) A knowledge of exploratory data analysis - how
to make plots, how to discover patterns with visualizations, how to
explore assumptions. (C) Scientific/contextual knowledge
- at least enough to be able to abstract and formulate problems.
This is what separates statisticians from mathematicians. (D) Skills
to distinguish true from false patterns - whether with p-values,
posterior probabilities, meaningful summary statistics,
cross-validation or any other means. (E) The ability to communicate
results to people without math skills - a key component of being a
statistician is knowing how to explain math/plots/analyses."-
2011 October 13-15.
Appalachian College Association (ACA) 2011 Summit
XIV. Crown
Plaza, Asheville, NC.
Schedule of QL
presentations.
Schield:
Abstracts of selected sessions. NNN meetings: Saturday: Guests
and prospective members: 4:30-6:30
PM. Supper and after-supper planning meeting. Sunday:
Board and planning meetings.
Caren Diefenderfer (Hollins) elected President; Eric Gaze (Bowdoin)
elected Vice President. Papers:
Teaching Teachers Statistical
Literacy Online by Schield
6up
-
2011 Oct
13. Measuring middle school students' interest in statistical
literacy.
Carmichael, Colin S. and Callingham, Rosemary and Hay, Ian and
Watson, Jane (2010) Mathematics Education Research Journal, 22
(3). pp. 9-39. ISSN 1033-2170
Abstract The
following paper describes the development of an instrument designed
to assess middle school students' interest in statistical literacy.
The paper commences with a review of the literature as it relates to
interest in this context and then proposes a theoretical model upon
which the proposed instrument is based. The Rasch Rating Scale model
is then applied to student responses to items in the instrument and
fit statistics are analysed in order to assess the extent to which
these responses conform to the requirements of the measurement
model. The paper then presents evidence, including interview data,
to support the validity of interpretations that can be made from the
proposed instrument. The findings suggest that the proposed
instrument provides a theoretically sound measure of middle school
students' interest for statistical literacy that will be useful for
the evaluation of interventions aimed at developing these students'
statistical literacy.
-
2011 Oct
6. Statistical Literacy for Medical Librarians: Swimming in a
Whirlpool of Conflicting Medical Claims by Instructor: Steve Simon, P. Mean Consulting. One-day (8 hours)
face-to-face for $175.
Course details.
-
2011 Sept 28.
Teaching Statistics in School Mathematics-Challenges for Teaching
and Teacher Education,
edited by Carmen Batanero, Gail Burrill, and Chris Reading. A
Joint ICMI/IASE Study: The 18th ICMI Study.
This Springer book is "intended to address the lack of attention to
teaching statistics by promoting international collaborative
research specifically focussed on the education and professional
development of teachers to teach statistics."
Springer: Cost $239;
Individual Book Chapter (Electronic Only) $24.95.
Amazon cost: $190.
Chapter 23.
Developing statistical literacy in students and teachers: Jim
Ridgway, James Nicholson, and Sean McCusker. Abstract: "While
statistical literacy is gaining much more recognition as something
that all citizens need in order to function fully in a modern
society, there is much less agreement as to exactly what is meant by
the term. This chapter discusses what statistical literacy is, why
it is important for children at school and for teachers. and the
need for our understanding to evolve to keep pace with developments
worldwide. It explores the potential of new curriculum in South
Africa and New Zealand, and the work being done in many different
countries by statistical agencies to support members statistical
literacy. A new case study where naive students and teachers develop
skills by engaging with complex evidence on a topic of real social
import is also described.
-
2011 Sept 16:
Statistical Literacy for All: Critical Thinking about Data
by Sue Finch and Ian Gordon. "An outstanding poster about a
top-ranked Statistical Literacy course for first-year college
students." StatLit Webmaster
-
2011: September 10-16.
Conference of The Mathematics Education into the 21st Century
Project.
Rhodes University, Grahamstown, South Africa. -
2011 Sept 17:
Vernier Grant to St. Joseph's College (Indiana).
To enhance quantitative literacy through student-developed interactive
projects.
-
2011 Aug 25:
Deming, Data and Observational Studies: by S. Stanley
Young and Alan Karr Published: Aug 25, 2011 - Significance Magazine, Volume 8
Issue 3 (September 2011) Doi: 10.1111/j.1740-9713.2011.00506.x “Any
claim coming from an observational study is most likely to be
wrong.” Startling, but true. Coffee causes pancreatic cancer. Type A
personality causes heart attacks. Trans-fat is a killer. Women who
eat breakfast cereal give birth to more boys. All these claims come
from observational studies; yet when the studies are carefully
examined, the claimed links appear to be incorrect. What is going
wrong? Some have suggested that the scientific method is failing,
that nature itself is playing tricks on us. But it is our way of
studying nature that is broken and that urgently needs mending, say
S. Stanley Young and Alan Karr; and they propose a strategy to fix
it.
-
2011: August 21-26.
58th World Statistics Conference,
International Statistical Institute (ISI). Dublin
Invited
Paper Sessions
Special Topic Sessions.
Proposed IASE-sponsored sessions and session organizers.
1st Bulletin
STS08 Statistical Literacy:
Making Sense of Statistical
Studies, Roxy Peck 6up; Statistics in the News,
Jean-François Plante, Nancy Reid
Interpreting Economic and Social Data, Othmar Winkler;
Multivariate Thinking in
Precollege Social Sciences, James Nicholson
Epidemiological Models and
Spotty Statistics,
6up Milo Schield (Session
organizer)
IPS 24 Causal Inference from Observational Studies Arvid Sjölander.
IPS 47 Applying Results of Statistics Education Research to Teaching
Statistics. Joan Garfield
and Hans Van Buuren
IPS 48 Teaching Courses in Probability Modeling. Alan Rossman
IPS 49 Should One Attempt to Integrate Qualitative Research
Approaches in Traditional Statistics Courses? If yes, how? Irena
Ograjensek
IPS 50 Opportunities and Pitfalls of E-learning, Virtual Learning
Environments and Open Education Resources.
Rolf Biehler and Abbas Bazargan
IPS 51 Enhancing Statistics Education Through International
Co-operation and the Use of International Data (joint with IAOS).
Reija Helenius
IPS 53 Using Popular Books and Entertainment in Teaching Statistics
Patrick. Murphy
STS 22: Key indicators as main tools for communicating statistics to
policy makers. Pieter Everaers
STS 34: The role of subject attitudes in learning statistics:
empirical evidence. Nalini Ravishanker
STS 36: Democracy and Statistics, Evdokia Xekalaki -
2011
August 19-20.
IASE Satellite Conference:
Statistics Education and Outreach.
Venue: 16 km north of Dublin Ireland in the
Grand Hotel in Malahide.
Deadlines: Other papers, posters,
presentations for the proceedings: 30th September 2011.
IASE
Satellite conference
Papers:
Schield: "Teaching the Social Construction
of Statistics."
6up -
2011 Aug 4-6.
MAA MathFest 2011,
Lexington, Kentucky. Registration and Housing open April, 1.
Abstract submission open in February.
Contributed paper
sessions (abstracts requested): (8)
Quantitative Reasoning and Literacy: Pedagogical Strategies.
This session is intended to look at the latest research into the
issue of Quantitative Literacy, as well as pedagogical issues and
strategies that have been employed at various institutions.
Organizer: Mike LeVan, Transylvania Univ.
Abstracts
must reach the MAA by Friday, April 29.
Minicourses:
An In-Class Role Playing Game for Quantitative Literacy: Social
Security, 1935 by John Curran and Andrew M. Ross, Eastern
Michigan Univ.
Panels: Assessing Quantitative Literacy, Organizer: Aaron
Montgomery, Central Washington University Panelists: Bernard
Madison, University of Arkansas, Semra Kilic-Bahi, Colby-Sawyer
College and Donna Sundre, James Madison University. Sponsor:
SIGMAA QL. "Quantitative Literacy (QL) and Quantitative
Reasoning (QR) requirements are becoming more common at the
undergraduate level and, as a result, there is a growing need for
assessment of student learning and program effectiveness in these
areas. While assessing basic mathematical proficiency has a long
history, both QL and QR skills are often described as being
exhibited within a deeper context. This need for context presents a
new challenge when developing assessment tools. This panel will
focus on presenting past experiences with developing assessment
strategies for quantitative literacy, both in terms of assessing the
level of understanding of an individual student and assessing the
effectiveness of a quantitative literacy program."
-
2011 Aug 1.
New ASA Fellows include Nolan, Weisberg and Thombs.
Deborah A. Nolan, University of California, Berkeley, CA, Herbert I.
Weisberg, Correlation Research, Inc., Needham, MA. Lori A.
Thombs, University of Missouri, Columbia, MO
-
2011 Aug 1.
International Statistical Literacy Project (ISLP) Newsletter 4.1
"The ISLP Poster Competition was a success
Results of the ISLP Poster Competition 2010-2011 will be announced
in ISI Dublin 2011 Congress. It is great that 4793 students
participated in the competition from all over the world." "We
are now gathering together persons who are interested in developing
the ISLP Strategy in the following areas: - schools - universities -
media - libraries - decision makers - citizens - national
statistical offices. Join us to develop the ISLP model."-
2011 July 21-22:
Workshop on
Inquiry-Based Statistics Education. Quantitative Analysis
Center, Wesleyan Univ. Two-day
Workshop on Inquiry-Based Statistics Education whose objective is to
provide attendees with a thorough introduction to a supportive,
multidisciplinary inquiry-based statistics curriculum and the
development of resources that take advantage of students’ natural
curiosity and provide a common language for approaching questions
across numerous scientific disciplines. We will tackle several of
the most common challenges in teaching a first course in statistics
including the need to cost effectively serve larger numbers of
students, providing opportunities for students to flexibly apply
their statistical knowledge, using computing as a window to core
statistical concepts, supporting students with varying levels of
preparation, attracting students from underrepresented groups and
fostering a desire for advanced course work.
Agenda,
Abstracts,
Presenters: George Cobb (Professor of Mathematics and
Statistics, Mount Holyoke College) and Lisa Harlow (Ph.D. Professor
of Behavioral Science, University of Rhode Island). You-tube
Inquiry-Based Statistics Education videos Contact:
Lisa Dierker, Ph.D. Professor and Chair, Quantitative Analysis
Center. -
2011 July 30 - Aug 4.
Joint Statistical
Meeting of the American Statistical Association (Miami, FL).
Program
Sun 4:50
Detecting Confounding and Evaluating the 10% Rule: R. Bliss, J.
Weinberg, V. Vieira and T. Webster
Sun 4:50
A First Time [Graduate] Course in Modern Causal Inference —
Eiliana Montero, University of Costa Rica
Mon 7:10 Roundtable ML08
One-page Tutorials
[on statistical methods/topics] Promoting Statistical Literacy -- Becki Bartelson,
Sec on Health Sci.
Mon 10:30-12:00 Contributed Session (#182. CC-B217):
Teaching Statistics Using
News Media, T. Paulette Ceesay;
Describing Quantitative
Relationships Using Informal Grammar,
Milo Schield 6up
1up WB1
WB2
Mon 2:00-3:50
Statistical Literacy 2011 session (#222. CC-A108/109):
Pop-stats books and Statistical Education
- Kaiser Fung, New York Univ. 1up.
Integrating Quantitative and Financial Literacy
- Joe Ganem, Loyola Univ., Maryland. 6up.
Statistics and Clinical Trials: Past, Present and Future
- Herb Weisberg, Correlation Research
1up.
Learning to Read the Numbers: Critical
Literacy and Numeracy in K-8 Classrooms - David and Phyllis Whitin,
Wayne State U. 1up.
Assessing
Quantitative Reasoning: What Do Freshmen Know? - Ermine
Faith Orta, Nandini Kannan and Kimberly Massaro, Univ Texas San
Antonio 6up. Milo Schield, organizer and
chair.
Mon 2:00-3:50
Causal Diagrams and Causal Inference.
External Validity and Transportability: A Formal Approach —
Judea Pearl, and Elias Bareinboim UCLA.
Alternative Graphical Causal Models and the Identification of Direct
Effects — Thomas S. Richardson, Univ. Washington ; James
M. Robins, Harvard School of Public Health.
Mon 3:05
Making Data Talk: Communicating Health Data with Lay Audiences
by David E. Nelson, Brad Hesse and Harry T. Kwon
Tues 7:00-8:15 Roundtable (268, TL07. CC-JR Ballroom D):
Teach Statistical Literacy with Epidemiology! — Daniel T Kaplan,
Macalester College
Tues 8:30-10:20
Outstanding Innovations in Statistics Education: Past, Present and a
Glimpse at the Future — Invited Panel Organizer: Amy G
Froelich, Iowa State University. Chair: Nicholas Jon Horton, Smith
College. Panelists: Amy G Froelich, Iowa State University
Roger Woodard, North Carolina State University Jo Hardin, Pomona
College. Discussant: Beth Chance, California Polytechnic State
University
Tues 10:30 - 12:20 International Statistical Literacy Session (#321.
CC-B218): Improving statistical literacy by international
cooperation, Organizer Reija Helenius, Director of ISLP. Chair:
Sonya Vartivarian, Government Accountability Office.
Strategies for Stimulating Statistical Literacy and Understanding
Quantitative Evidence in Higher Education in the UK — Gillian
Lancaster, Lancaster University. Mary Townsend
(Statistics Canada) 11:25 Statistical Literacy and the
Common Core Curriculum in the United States by Roxy Peck, California
Polytechnic at San Louis Obispo.
6up 1up. Discussant: Milo Schield, W. M. Keck Statistical
Literacy Project, Augsburg College.
Tues 10:30-12:30
Invited panel. Teaching Statistics through Regression
Daniel Kaplan Organizer and Chair. Panelists: Felicity Enders,
Mayo Clinic; Shonda Kuiper, Dept. of Math and Statistics; Daniel T
Kaplan, Macalester College; Laura Sather Zielgler, Dept. of
Statistics.
Tues
Conceptualizing and Measuring "Data Habit-Of-Mind": Saad Chahine,
OISE/university of Toronto.
Tues 1:30-3:00. Business Meeting of Statistics in Business
Schools Interest Group in (HQ-Lucina). 1. Ratify constitution 2. Election of officers 3. Program for JSM 2012
4. Details of the MSMESB program at the Decision Sciences meetings
(Boston in November).
Tues 2:35
A Comparison of Students' Inferential Reasoning in Three College
Courses Sharon Lane-Getaz, Saint Olaf College
Tues 3:05
Assessing the Change in Student Attitudes towards Statistics at the
University of Tennessee Ramon Leon and Adam Petrie.
Wed 7:00-8:15 Roundtable
Information Criteria, Bayesian Methods and their Implications for
Statistical Literacy: Rochelle E. Tractenberg Georgetown Univ.
Medical Center
Wed 8:30-10:20 Late breaking session. US Supreme Court
"Statistical significance is not necessary for causation" (438.
CC-JR Ballroom AB) Speakers: Stephen
T. Ziliak 1up, Joseph "Jay" Kadane, Donald Rubin and Daniel Kaplan
1up.
Organizer and chair: Milo Schield
6up 1up
Wed 8:30-10:20 Invited Session: Statistics - the secret weapon of
successful web giants. 8:35 AM Conditional Regression Models —
William D Heavlin, Google; 9:00 AM The Effectiveness of Display Ads
— Tim Hesterberg, Diane Lambert, David X. Chan, Or Gershony and Rong
Ge, Google;
Wed 8:30-10:20
Preparing Students for the Future of Analytics
Organizer-Chair: Michael Rappa, Institute for Advanced Analytics
at North Carolina State University Panelists: Aric LaBarr,
Institute for Advanced Analytics at North Carolina State University;
Russell Zaretzki, The University of Tennessee Knoxville; Jerry
Oglesby, SAS; Dan Thorpe, Sam's Club.
Wed 10:30-12:20 Poster 47.
Remediating Misconceptions of Confidence Intervals using Simulations
and Visualizations — Chong Ho Yu, Arizona State University ;
Samuel DiGangi, Arizona State University ; Angel Jannasch-Pennell,
Arizona State University
Wed 10:30-12:20 Poster 52:
Zebras vs. Hats: Exploiting the Lexical Ambiguity of the Word Random
— Neal T. Rogness, Grand Valley State University; Diane G. Fisher,
University of Louisiana at Lafayette; Jennifer J Kaplan, Dept. of
Statistics and Probability
Wed 12:30-1:50 Roundtable General Social Survey (GSS)--
Studying Societal Change. Survey Research Methods Tom Smith
Wed 2:05
Causal Mediation Analysis for Nonlinear Models with Confounding:
Jeffrey M. Albert, Case Western Reserve University
Wed 3:05
Gaining Inzight - Chris J. Wild and Dineika Chandrananda
University of Auckland
Wed 6:00 Statistical Education Business Meeting
Thurs 10:30
Significance Magazine: Communicating Statistics to the World —
Invited Panel. Howard Wainer, National Board of Medical
Examiners Andrew Solow, Woods Hole Oceanographic Institution Ian
MacDonald, Florida State University. Organizer: Julian G.
Champkin, RSS. Chair: Ron Wasserstein, ASA.
-
2011: July 15.
Supporting the Royal Statistical Society's ten-year statistical
literacy campaign.
"The aim of fostering improved science and number literacy in the
journalism community is shared by a number of organisations and
people and the campaign is making progress."
-
2011 July 15 Deadline for uploading
ASA awareness YouTube videos.
A contest for short films about
statistics and statisticians. The competition is intended to
stimulate public awareness of the many facets of statistics and life
as a statistician. Each entry will be judged on two equally
weighted criteria: quality of statistical content and entertainment
value.
-
2011 July
5. Making Data Meaningful: Guide to Statistical Literacy by Vadim Isakov UNECE. 6up.
Document-Part
4
-
2011 July 1:
Twenty-First-Century Quantitative Education: Beyond Content
by Shannon Dingman and Bernard Madison, University of Arkansas. In
the AAC&U's Peer Review Summer 2011, Vol. 13, No. 3.
"Traditional high school and nonmajor mathematics courses generally
focus on calculation and manipulation of mathematical
representations (functions, equations, expressions). Of course, this
is still important, and regardless of the fact that much of this can
be done by technology, understanding how it is done remains
important. However, QR education (and many other learning outcomes)
requires that we broaden teaching to include competencies such as
interpretation of information and data, developing and evaluating
assumptions, conducting analysis and synthesis of solutions to make
sound judgments and conclusions, and communicating one’s thoughts in
an organized and coherent manner."
Copy
-
2011 June 30.
Blejec, North and Schield elected ISI members. The International Statistical Institute (ISI)
elected 56 new
members. Three are members of the International Association of
Statistical Educators (IASE). Andre Blejec (Ljubljana,
Slovenia) organized the 2010 ICOTS in Ljubljana. Delia North
(Durban, South Africa) was the local chair of ICOTS6 which was held
in Cape Town in 2002. Milo Schield (Minneapolis, USA) has
organized sessions and given contributed and invited papers at
numerous IASE, ISI and ICOTS conferences. According to the ISI
office (as of July), there are "1980 elected ISI members, of which
164 have an IASE membership. Of the 164, 27 have US Nationalities
and of the same 164, 30 have US as country of residence."
-
2011 June 26-29.
18th International Conference of Adults Learning Mathematics
(ALM-18). Dublin Ireland. ALM
-
2011 June 22.
The Spread of Evidence-Poor Medicine via Flawed Social-Network
Analysis by Russell Lyons, Indiana University.
Numeracy 2011 Volume 2 Issue 1. "How did these errors
arise and pass inspection? We believe that one major reason is that,
as many before us have said, statistical assumptions are routinely
made when they are unlikely to hold. The motivation for making
assumptions is the hope of overcoming the limitations of
observational data, especially for causal inference. In any
particular case, some of those limitations are known, while others
are unknown. Yet viewing observational data through the lens of
statistical modeling produces new biases, generally unknown and
mostly unacknowledged, lurking in mathematical thickets.
Unfortunately, controlling for selection effects and other
confounders is extraordinarily difficult in observational studies
(Ioannidis, 2005a); this is the main reason that observational
studies are regarded with skepticism. Indeed, as demonstrated with
the well-known studies concerning hormone-replacement therapy, it
was impossible to control the observational studies to get the same
effects as the experiments (Petitti and Freedman, 2005, Freedman and
Petitti, 2005). Observational studies often lead to publications
whose causal conclusions contradict one another or are contradicted
by experiments (Ioannidis, 2005a, Maziak, 2009, Taubes, 1995); this
is a natural consequence of poor methodology."
"Indeed, an obvious “cure” for poor statistical practice is to
improve statistics education. While there is widespread agreement on
the need for statistical literacy among the populace at large,
efforts to improve the statistical competence of those who become
practitioners receive less attention."
"We see the problems with existing statistics education as follows.
Although most statistics courses mention the importance of the
assumptions behind the techniques they present, few devote much time
to this topic. Such lack of attention is especially prevalent in
more advanced courses taught in a variety of disciplines, yet the
assumptions behind more advanced techniques are considerably more
subtle than those in elementary courses. Most students, who are
generally practically minded, learn not to question whether the
assumptions hold in practical situations— or, at least, students do
not learn to question the assumptions. Many such students later
become practitioners and, often, educators themselves: more
statistics is taught outside statistics departments than within. In
the face of academic pressure to publish papers, assumptions become
inconvenient and further marginalized, even though all assent to
their importance."
"An examination of statistics education, as Duncan suggested, is
overdue. Educators need not wait for any report, however, before we
ourselves teach critical thinking." [Emphasis added here].
-
2011 June 7.
SJIAOS:
Statistical Literacy and Official Statistics. (SJIAOS)
27 (2011)
Table of Contents.
Editorial by S-M. Tam p 95-98; How statistical literacy, official statistics and self-directed
learning shaped social enquiry in the 19th and early 20th centuries
by Gillian A. Lancaster p 99-112. Official Statistics and statistical literacy: They need each other
by Sharleen Forbes, Mike Camden, Nathaniel Pihama, Paul Bucknall and
Maxine Pfannkuch p 113-128. The national statistical agency as educator by Mary Townsend
p 129-136. Statistical literacy and awareness as strategic success factors of a
national statistical office – the case of Statistics Finland by
Reija Helenius and Heli Mikkelä p 137-144. Creating statistically literate global citizens: The use of IPUMS-International
integrated census microdata in teaching by Ann Meier, Robert McCaa
and David Lam p 145-156. The millennium development goals, national statistical offices, the
international statistical literacy project and statistical literacy
in schools by Juana Sanchez, Sharleen Forbes, Pedro Campos, Paola Giacche, Mary Townsend, Gai Mooney and Reija Helenius
p 157-172. Statistical Literacy: A New
Mission for Data Producers by Milo Schield, p 173-183. Responding to diversity in users' statistical literacy and
information needs: Institutional and educational implications by
Iddo Gal and Scott T. Murray p 185-196. Foundations for improving statistical literacy by Jane M. Watson
p 197-204. Developments of AtSchool projects for improving collaborative
teaching and learning in statistics by Neville Davies p 205-228.
Does CensusAtSchool develop statistical literacy? by Iddo Gal
229-230. Discussion by Chris Wild p 231-234. Rejoinder to Wild and Gal's
comments by Neville Davies p 235-326.-
2011
May 19-21. USCOTS
2011: The Next Big Thing.
Program.
Plenary speakers: Allan Rossman & Beth Chance, Robert Gould,
Dennis Pearl, Wayne Stewart and Robert delMas. Talk: Roxy
Peck "What is the Next Big Thing and Will We be Ready for It?"
StatLit Posters: Marc Isaacson
Poster
"Where Do Statistics Come From? - Setting the Table for Introductory
Statistics". Milo Schield and Daniel Kaplan
Poster "Modeling in Context:
Teaching Confounding and Adjustment through the Common Core
Standards".
StatLit Teaching-Theater (Seven minute teaching activities): Marc Isaacson
6up Multiple-Choice
Olympics. Milo Schield
6up Hypothetical Thinking about Statistics.
Location: Embassy Suites Hotel in Raleigh-Durham (Research Triangle) North
Carolina.-
2011 May 16 - July 1.
Statistical Literacy Course
100% Online. Augsburg
College GST 200.
Syllabus
Summer Session Details
Registration opens April 18.
2010 Summer Registration form.
For non-students to register, fax the completed registration form to
612-330-1425 Attention Linda. Allow 2 business days for
processing your registration. To make payment using a credit
card, contact Cory Snyder: 612-330-1037. Late fee for
registration or payment received after May 16.
-
2011 May 12-15.
60th Annual Conference American Association for Public Opinion
Research. Phoenix AZ. -
2011 May 10:
ASA supports Statistics
Teaching, Aptitude and Training (STAT) Act of 2011.
“The ASA commends Congressman Loebsack for his leadership in
promoting statistical literacy,” said Robert Rodriguez, ASA
president-elect. “K-12 statistics education is essential for
equipping students with the workforce skills and critical thinking
necessary in our data-driven society.”-
2011 May 10:
Statistics Teaching, Aptitude and Training (STAT) Act of 2011
introduced by Congressman Loesback.
"To amend the Elementary and Secondary Education Act of 1965 to
provide for the development of State statistical literacy plans and
to authorize the Secretary of Education to make grants for
statistics-related teacher professional development and the
improvement of statistics education." P. 2 "The Congress finds
the following: (1) Statistical literacy, the understanding and use
of the language and tools of statistics, is vital for United States
citizens in an era of intense global competition and growing
reliance on data..."
Excerpt
P. 29: "the term ‘statistical literacy’ means the
understanding of and ability to use the language and tools of
statistics, including the ability to— (1) ask and evaluate critical
questions about the design of a study and the appropriateness of the
conclusions drawn from a study; (2) distinguish arguments based on
data and evidence from arguments based on anecdotes; (3) recognize
and interpret different representations of data in context; and (4)
formulate questions that can be addressed with data, collect and
organize relevant data, and draw appropriate statistical
conclusions."
Organizations supporting STAT Act. "Statistical
literacy especially enhances the reasoning skills so critical to
everyday decisions because it takes into account uncertainty.
Statistical literacy is also the ability to read, understand, and
use quantitative information." "being statistically literate
means being armed with the skills necessary to understand and
interpret data and weigh risks and rewards to make decisions in the
presence of uncertainty."-
2011 May 10:
Odysseys anonymous
web forum. Poster by Milo Schield and
Larry Copes-
2011 April 28: ASA accepts proposal for
late-breaking session: US Supreme Court -- "Statistical significance
is not a necessary condition..."
Scheduled: Wed 8:30 AM Aug 2. Panelists: Stephen Ziliak, Joseph
Kadane, Donald Rubin and Daniel Kaplan. Organizer: Milo
Schield.
-
2011 April 12. "Eat Less Salt, Drink
More Wine, Dump The Cell phone, Eat More Salt, And Live Longer:
Teaching
Students To Understand The Role Of Data Collection In Statistical
Inference." Rob Gould, UCLA
2:00 to 2:30 pm Eastern time. "The role
that data collection plays in causal inference is of fundamental
importance in introductory statistics, and yet is outside the
comfort zone for many of us. In this webinar, I'll discuss why
causal inference is important and also fun, and give some advice for
teaching this topic."
-
2011 April 1.
Statway and Quantway: Mathematics Pathways to Student Success in
Community Colleges. "A
one hour discussion online. Carnegie and its partners are addressing
the low success rate of developmental mathematics students by
providing alternatives to the current community college mathematical
sequence and content. The Statistics Pathway (Statway) is designed
to take developmental math students to and through transferable
college statistics in one year. Quantway provides an alternate and
accelerated pathway with an innovative quantitative literacy focus
in which students use mathematics and numerical reasoning to make
sense of the world around them."
Dana Center
Pathways: Statway and Quantway.
What is QL?-
2011 March 25. Applications due,
Director of
Quantitative Learning Program and Center, Bryn Mawr College.
-
2011 March 19.
NECQL, Northeast
Consortium for Quantitative Literacy,
15th Annual Meeting.
Univ of Massachusetts Boston.
Featured speaker: Deb Hughes-Hallet, Univ. of
Arizona.
-
2011 March 7.
Lexical Ambiguity in Statistics: The Cases of Random
and Spread.
Iowa Stat Univ. 4:10-5:00 pm, Snedecor 3105. Speaker: Jennifer J.
Kaplan, Michigan State U.
-
Feb
25: ‘The Data Generation’, a statistical literacy workshop
at the RSS headquarters, London. "Hello, the Young Statisticians
Section of the Royal Statistical Society would like to bring [this]
workshop to your attention. Organised by the
Young Statisticians Section of
the RSS, this event is designed to present ongoing efforts to
promote statistical thinking and to increase the comfort level in
talking and using statistics. A range of speakers, keen to relay the
importance of statistical literacy in the current era, will provide
insight into the Voice of Young Science, Sense About Statistics and
the getstats campaigns.
David Spiegelhalter [Understanding
Uncertainty] will share his life-long experience in interacting
with the public, the media and politicians and the event will round
off with a workshop on engaging with the media by Andrew Garratt
[Media officer] from the Royal Statistical Society."
-
Feb 23-35.
Welcome to the 2011 Winter Institute on Statistical Literacy for
Librarians (WISLL). "This Institute provides training in the strategies and tools for
finding statistics and providing them in formats directly useful to
users." "of interest to reference librarians working in
academic, public and special libraries that serve user communities
with interests in statistical information" "Participants will work
with a variety of online official and non-official statistical
sources and with the tools for finding and retrieving them. This
workshop will not provide instruction about how to do data analysis,
nor will it provide assessment training" University of Alberta, Edmonton, Canada.
-
2011:
Education Vision:
Royal Statistical Society.
"Our vision is that 'statistical literacy' should be seen
within society as being a vital life skill."-
2011: Jan 6 - 9. Joint Mathematical Meeting,
MAA-AMS
New Orleans.
Program.
Wed. 8:30 am - 5:00 pm Workshop on Statistics Teaching
introductory statistics following GAISE and the Common Core. Robert
Gould.
Thurs 8:00 am An Action Research Report: <snip> Chance that a
Student will make an "Innumeracy Type" Statistical Error? Larry
Lewis.
10:20 am An analysis of student understanding of voting power in a
a quantitative literacy class. Curtis D. Bennett et al.
2:55 pm Serve While You Learn: A Quantitative Literacy Course.
Karen Stanish.
5:30-6 pm
SIGMAA-QL Business Meeting
La Galerie 6, 2nd Floor, Marriott
6-7 pm SIGMAA-QL. Reception, Panel Discussion La Galerie 6, 2nd Fl, Marriott
Mathematics and democracy ten years
later. Schield 6up
Friday 8:00 am. Confounding the Traditional Introductory Statistics
Course. Daniel T Kaplan.
8:40 am.
Teaching Statistical Literacy
Using Odysseys2Sense: a Unique Web-Based Forum. Milo Schield.
Abstract
6up
Odysseys poster
10:30 am-12:30 pm. MAA Minicourse: #5: Part A
A Game Theory path to quantitative literacy. David L. Housman and
Richard Gillman.
1:00 - 3:00 pm. MAA Minicourse #10: Part A Teaching introductory
statistics: Michael A. Posner and Carolyn K. Cuff.
1-2:20 pm. Report from ICOTS: A world view of statistics education.
Panelists: Rob Carver, Katherine Halvorsen
6up, John McKenzie, Milo Schield
6up, and Gail Burrill.
1:00 pm. Mathematical Literacy and Quantitative Literacy: Symbiosis
or Competition? Deborah Hughes Hallett.
1:20 pm. Quantitative Reasoning and Students' Approaches to Solving
Novel Problems. Kevin C. Moore.
1:30 pm. Reorganizing School Mathematics for Quantitative Literacy.
Rick Gillman.
2:00 pm. Quantitative Reasoning in the Contemporary World. Caren
Diefenderfer, Bernard Madison, Stuart Boersma & Shannon Dingman.
2:00 pm. QL and the "Big Ideas" of High School Mathematics. Brian Beaudrie, Emily Ricard, Greg Superchi and David Gilcreast.
2:30 pm. Quantitative Literacy and College Readiness. Cathy L
Seeley.
3:00 pm. The Role of QL in the High School Mathematics Curriculum:
What Students Need to Know to Be College Ready. Corri Taylor.
3:30 pm. The Role of QL in the High School Mathematics Curriculum
Panel Discussion. Eric C Gaze.
Friday 5:45 -7:15 pm.
SIGMAA Statistics
Education Business Meeting and Reception La Galerie 6, 2nd
Floor, Marriott
Saturday 1-2:20 pm. Teaching statistics online.
Panel: Michelle Everson,Patricia Humphrey,
Michael Miner and Sue Schou.
1:00 pm. The war on apathy in a terminal statistics course:
Motivating definitions from day one. Gregory Johnson & Christopher
Shaw.
Sunday 1-5:30. MAA Session: Alternative Approaches to
Traditional Introductory Statistics Courses. Organized Gill,
Boynton and Posner
1:00 pm. Two-way tables: A path less traveled. Melinda Miller Holt
and Stephen M. Scariano, Sam Houston State University.
1:00 pm. Not your mother's college algebra course -- rethinking how
we prepare students for QR across the disciplines. Suzanne Doree.
2:00 pm. A different flavor of introductory statistics: Teaching
students to really cook. Robert delMas et al.
3:20 pm. Faculty and Student Support for Quantitative Reasoning and
How to Make it Count. David G Taylor, Roanoke College.
1:00 -3:00 p.m. MAA Minicourse: #5: Part B A Game Theory path to
quantitative literacy. David L. Housman and Richard A. Gillman.
3:30 -5:30 p.m. MAA Minicourse #10: Part B Teaching introductory
statistics. Michael A. Posner and Carolyn K. Cuff.
|
|
Amazon Best Selling Books in
Statistics |
|
Most Popular NEW Books in Statistics
Popularity:
Advanced Search: Subject = Science: Keyword = Statistics. Published
during 2011. Excludes new editions, Kindle editions and
non-books: game cards, calendars, Cliff notes, coloring books, GRE
workbooks.
#1
The Theory That Would Not Die: [Bayes' Rule] by Sharon B. McGrayne
#2 The Upside of Irrationality: Benefits of Defying Logic by Dan Ariely
#3 Scale Development: Theory and Applications by Robert F. DeVellis
#4 Algorithmic Puzzles by Anany Levitin and Maria Levitin
#5 Statistical Analysis: Microsoft Excel 2010 [Paperback] Conrad
Carlberg
#6 Statistics book Your Professor Doesn't Want You to Have S. Deviant
#7 Elementary Decision Theory by Herman Chernoff and Lincoln E. Moses
#8 Statistics for Spatio-Temporal Data by Noel Cressie and C.K.
Wikle
#9 Precision: Statistical-Mathematic Methods in Horse Racing. CX Wong
10 Statistical Abstract of the US, 2011-2012: by U.S. Dept Commerce
11 Futurecast: What Today's Trends Mean for Tomorrow's World. G Barna
12 Economic Indicators For Dummies by Michael Griffis
13
Understanding The New Statistics: Effect Sizes, etc. Geoff Cumming
14 Social Network Analysis: History, Theory and Methodology by C. Prell
15 Bayesian Population Analysis w WinBUGS by Marc Kery and M. Schaub
16 Statistics for the Behavioral Sciences by Gregory J. Privitera
17 Thinking Statistically by Uri Bram
18 Structural Equation Modeling with Mplus by Barbara M. Byrne
19 Uneducated Guesses: Uncover Misguided Education Policies. H Wainer
20 Econometrics by Example by Damodar N. Gujarati |
Most Popular books: Professional-Statistics
Popularity:
Advanced Search: Science-Math, Keyword = Statistics.
Note: Ignores Kindle-only books, Kindle editions, free Creative Commmons
(CK-12) books and required "books" (c.f., My MathLab - Student Access).
#1
Outliers: The Story of Success by Malcolm Gladwell
#2 Diagnostic and Statistical Manual of Mental Disorders DSM-IV-TR. APA
#3 Scorecasting: The Hidden Influences by T Moskowitz and J.
Wertheim
#4 The Black Swan: The Impact of the Highly Improbable. Nassim Taleb
#5 Freakonomics by Steven D. Levitt and Stephen J. Dubner
#6 The Visual Display of Quantitative Information, 2nd ed. by Tufte.
#7 Moneyball: The Art of Winning an Unfair Game by Michael Lewis
#8 Research Design: Qualitative, Quantitative & Mixed Methods, Creswell
#9 Fifty Challenging Problems in Probability with Solutions by F.
Mosteller
10 Envisioning Information
by Edward R. Tufte.
11 The Visual Miscellaneum: Most Consequential Trivia by D McCandless
12 Understanding a Wager by Ramy Tadros
13 Math Jokes 4 Mathy Folks by G. Patrick Vennebush
14 How to Lie with Statistics by Darrell Huff and Irving Geis
15 Cartoon Guide
to Statistics by Larry Gonick, Woollcott Smith.
16 A Monetary History of the US, 1867-1960 by Friedman and Schwartz
17 Capitalism Hits the Fan: by Richard D. Wolff
18 Elementary Statistics (11th Edition) by Mario F. Triola
19 The End of Poverty: Economic Possibilities for Our Time by J. Sachs
20
Discovering Statistics Using SPSS by
Andy Field. |
|
Amazon Best Selling Books in
Statistics and Math |
|
Most Popular Books: Science-Statistics
Popularity:
Advanced Search: Science-Math, Keyword = Statistics.
Note: Ignores Kindle-only books, Kindle editions, free Creative Commmons
(CK-12) books and required "books" (c.f., My MathLab - Student Access).
#1 Outliers: The Story of Success by Malcolm Gladwell
#2 The Visual Display of Quantitative Information, 2nd ed. by Tufte.
#3
Research Design: Qualitative, Quantitative & Mixed Methods Creswell
#4 Fifty Challenging Problems in Probability with Solutions by F.
Mosteller
#5 Envisioning Information
by Edward R. Tufte.
#6 How to Lie with Statistics by Darrell Huff and Irving Geis.
#7 Cartoon Guide
to Statistics by Larry Gonick, Woollcott Smith.
#8 The Drunkard's Walk: How Randomness Rules Our Lives. L.
Mlodinow
#9
Discovering Statistics Using SPSS by
Andy Field.
10. Barron's AP Statistics by Martin Sternstein
11. The Theory That Would Not Die: [Bayes' Rule] by S. McGrayne
12. What is a p-value anyway? 34 Stories ... by Andrew Vickers
13. How to Measure Anything: Valuing Intangibles in Business, Hubbard
14. Probabilistic Graphical Models: Principles/Techniques.
Koller+Friedman
15. Fooled by Randomness:
The Hidden Role of Chance by Nassim Taleb.
16. Against the Gods: The Remarkable Story of Risk by Peter L. Bernstein
17. Visual Explanations: Images-Quantities, Evidence-Narrative. E Tufte
18. The Basic Practice of Statistics: w/Student CD by David S. Moore
19. Epidemiology: by Leon Gordis
20. Numbers Rule Your World: The Hidden Influence ... by Kaiser Fung |
Most Popular
Books: Mathematics
Amazon bestsellers in
Science&Math>Math> Top 20: Excludes Kindle editions and non-books: game
cards, calendars, Cliff notes, coloring books, GRE workbooks.
#1 Outliers: The Story of Success by Malcolm Gladwell
#2 Magical Mathematics: Mathematical Ideas by P. Diaconis, R. Graham
#3 My Best Mathematical and Logic Puzzles by Martin Gardner
#4 Gödel, Escher, Bach: An Eternal Golden Braid by D. R. Hofstadter
#5. Secrets of Mental Math: Mathemagician's Guide, Benjamin & Shermer
#6 The Big Book of Brain Games by Ivan Moscovich, Ian Stewart.
#7 The Drunkard's Walk: How Randomness Rules Our Lives. L. Mlodinow
#8 The Visual Display of Quantitative Information, 2nd ed.,
by Tufte
#9 Envisioning Information
by Edward R. Tufte.
10 Fifty Challenging Problems in Probability with Solutions by F.
Mosteller
11 Brain Teasers: 211 Logic Puzzles, etc. by Ian Livingstone, J. Thomson
12 Freakonomics (and Other
Riddles of Modern Life) Levitt, Dubner [HC]
13 Research Design: Qualitative, Quantitative & Mixed Methods, Creswell
14 Journey through Genius: The Great Theorems of Math by W. Dunham
15 Discovering Statistics Using SPSS by Andy Field
16 Math Jokes 4 Mathy Folks by G. Patrick Vennebush
17 Algebra Survival Guide by Josh Rappaport, Sally Blakemore
18 Flatland: A Romance of Many Dimensions by Edwin A. Abbott
19 Quantitative Analysis for Mgmt (10th Ed) by Render, Stair amd Hanna
20. Entertaining Mathematical Puzzles by Martin Gardner |
REFERENCE BOOKS |
|
Philosophy of Statistics, Volume 7 (Handbook of the Philosophy of
Science) Bandyopadhyay and Foster, editors. The essays in this Handbook
are concerned with problems of induction, statistics and probability.
Provides a bridge between philosophy and current scientific findings.
Covers theory and applications. Encourages multi-disciplinary
dialogue. $165. |
StatProb: The Encyclopedia, sponsored by Statistics and Probability
Societies, combines the advantages of traditional wikis (rapid and
up-to-date publication, user-generated development, hyperlinking, and a
saved history) with traditional publishing (quality assurance, review,
credit to authors, and a structured information display). All
contributions have been approved by an editorial board.
First online: Oct
2010. As of Dec 2011: 57 published entries total. 165
published concepts total. |
|
AMAZON RANKINGS:
STATISTICS TEXTBOOKS |
|
Amazon.com US sales ranks
in books as of Dec 10, 2011. Sales-ranks:
100 sales/wk=4,000th;
60 /wk=10,000; 10/wk=100K;
1/wk=400K.
These rankings fluctuate daily and don't
include sales made directly by publishers to bookstores.
Rankings via www.salesrankexpress.com.
Rank Author: Title
6,437 Field:
Discovering Statistics Using SPSS 3rd
7,778 Gonick and Smith:
Cartoon Guide to Statistics 1st
9,456 Triola:
Elementary Statistics 11th
10,959 Rumsey:
Statistics for Dummies I 2nd
16,328 Moore:
The Basic Practice of Statistics 5th
17,698 Salkind:
Statistics for People Who (Think They) Hate Statistics 4
20,819 Gravetter
et al:
Essentials of Statistics
Behavioral Sciences 7th
21,091 Rumsey: Statistics for Dummies
II 1st
24,483
Larson and Farber:
Elementary Statistics: Picturing the World
4th
24,594 Bluman:
Elementary Statistics: A
Brief Version 5th
25.073
Hinders:
5 Steps to a 5 AP Statistics 2012-2013
26,389
Sullivan:
Fundamentals of Statistics
3rd
27,615
Triola:
Essentials of Statistics 4th
28,959 Bennett-Briggs:
Using & Understand Math: QR Approach 5th
31,209
Donnelly:
The Complete Idiot's Guide to Statistics 2nd
33,212 Urdan:
Statistics in Plain English
3rd
33,908
Wackerly, Mendenhall and Scheaffer. Mathematical Statistics 7th
33,964
Brussee
Statistics for Six Sigma Made Easy 1st
34,375
Agresti, Franklin:
Statistics:
Art/Science Learning from Data 2nd
34,901
Tabachnick and Fidell.
Using Multivariate Statistics 5th
36,316
Larson and Farber:
Elementary Statistics: Picturing the World 5th
39,154
Levine et al.,
Statistics for Managers using Excel 6th
39,305
Sullivan:
Statistics: Informed Decisions Using Data
3rd
40,945 Bluman:
Elementary Statistics: A Step By Step Approach 7th
43,424
Timothy Urdan:
Statistics in Plain English 3rd
46,157 Moore, McCabe, Craig:
Introduction to Practice of Statistics 6th
49,214 Moore and Notz:
Concepts and Controversies 7th
50,814 Freedman, Pisani and Purves:
Statistics 4th
58,769 COMAP:
For All Practical Purposes: Mathematical Literacy
... 8th
65,591
Bennett et al.,
Statistical Reasoning For Everyday Life
3
67,826 McClave, Sincich and Mendenhall:
Statistics
11th
77,272 Howell:
Fundamental Statistics for the Behavioral Sciences 7th
80.902 Brase and Brase:
Understandable Statistics 9th
83,867
Miller, Heeren and Hornsby:
Mathematical Ideas 12th
|
84,932 McClave
and Benson:
Statistics
for Business Economics 11th
85,757
Miller, Heeren and Hornsby:
Mathematical Ideas 11th
90,389
Nolan and Heinzen:
Statistics for the Behavioral Sciences 1st
91.736 Brase and Brase:
Understandable Statistics
10th ed.
92,421 Utts:
Seeing Through Statistics (3rd)
NovelRank
93,886
Agresti & Finlay:
Statistical Methods for Social Sciences 4th
95,713
Voelker, Orton and Adams:
Statistics (Cliffs Quick Review) (1st)
96,597
Hand:
Statistics -- A Very Short Introduction
97,204 Moore, McCabe et al
The Practice of Business Statistics 2nd
113,984
Witte and Witte:
Statistics
9th
129,884 Moore et al
The Practice of Statistics for Business/Econ 3rd
143,507 Burger and Starbird:
Heart of Mathematics (3rd)
195,988 Sprinthall:
Basic Statistical Analysis 8th
234,075
Pearson:
Statistical Persuasion:..Collect, Analyze, Present Data
298,672
Johnson:
Statistics: Principles and Methods
6th
300,030
Woloshin et al.
Know Your Chances: Understand Health Stat
300,156 Sevilla and Somers:
QR: Tools for Today's Citizen
1st
322,331 Utts and Heckard:
Mind on Statistics 3rd 770p.
353,666 Rossman, Chance:
Investigating Statistical Concepts ... 1st
430,814
Rossman et al
Workshop Statistics
with Data & Graph Calculator
451,274
Utts and Heckard:
Statistical Ideas and Methods 1st
464,814
Rossman-Chance:
Workshop Statistics:
Discovery with Data
523,659 Kiess, Green:
Statistical Concepts for Behavioral Sciences 4th
768,716 Langkamp and Hull:
QR and the Environment
1st
836,137 Bennett, Briggs:
Essentials of Using and Understanding Math
894,235 Greenleaf:
Quantitative Reasoning: Understand Nature
2nd
944,741
Aufmann and Lockwood:
Mathematical Thinking and QR
(1st)
1,290,838 Madison et al.,
Case Studies for QR: Media Articles 2nd.
1,465,983 Bennett and Briggs:
Themes of the Times on QL 4th
1,844,508
Fusaro, Kenschaft:
Environmental Math in the Classroom
1st
2,019,882 Jeffrey Bennett:
Math for Life 1st
2,165,582 Sons:
Mathematical Thinking & Quantitative
Reasoning 4th
2,337,671 Abramson and Isom:
Literacy
and Mathematics 1st
2,839,721 Richman et al:
Mathematics for Liberal Arts
2,912,304 Pierce, Wright, Roland:
Mathematics for Life: ... QL
6,838,550 Burkhart: Quantitative and Qualitative Reasoning Skills
******
Andersen, Swanson:
Understanding our Quantitative World
Not
ranked: Common Sense: Rethinking QR
No rank
Levine and Stephan.
Even You can Learn Statistics 2nd ed.
|
|
Top 25 Statistical Literacy
Papers: Ranked by Citations |
|
Data from Google Scholar (Dec., 2011).
Search on "Statistical Literacy," all areas, exclude patents, summaries
only.
|
Rank |
Citations |
Description |
|
1 |
265 |
I. Gall (2002). Adults' statistical literacy: Meanings,
components, responsibilities. International Statistical Review. |
|
2 |
126 |
JM Watson (1997). Assessing statistical thinking using the
media. In The Assessment challenge in Statistics Education. |
|
3 |
119 |
J Garfield (2002). The challenge of developing statistical
reasoning. Journal of Statistics Education. |
|
4 |
111 |
B Chance (2002). Components of statistical thinking;
implications for instruction and assessment. Journal of
Statistics Education. |
|
5 |
107 |
JB Garfield (2003). Assessing statistical reasoning.
Statistics Education Research Journal. |
|
6 |
106 |
KK Walman (1993). Enhancing statistical literacy:
Enriching our society. Journal of the American Statistical
Association. |
|
7 |
100 |
J Watson, R Callingham (2003). Statistical literacy: A
complex hierarchical construct. Statistics Education Research
Journal. |
|
8 |
86 |
DJ Rumsey (2002). Statistical literacy as a goal for
introductory statistics courses. Journal of Statistics
Education. |
|
9 |
71 |
Watson, Kelly, Callingham (2003). Measurement of school
students' understanding of statistical variation. Education in
Science. |
|
10 |
66 |
D Ben-Zvi, et al. (2004). The challenge of developing
statistical literacy, reasoning, and thinking. [book] |
|
11 |
56 |
D. Ben-Zvi (2004). Statistical literacy, reasoning, and
thinking: Goals, definitions, and challenges. See 2004 book |
|
12 |
45 |
S Lajoie (1998). Reflections on statistics: Learning, teaching,
and assessment in grades K-12. Book |
|
13 |
39 |
JM Watson, JB Moritz (2000). Development of understanding of
sampling for statistical literacy. Journal of
Mathematical Behavior |
|
14 |
36 |
I Gal (2005). Statistical literacy. The Challenge of
developing statistical literacy |
|
15 |
33 |
J Garfield (2005). Research on statistical literacy,
reasoning, and thinking.... The challenge of developing
statistical literacy |
|
16 |
32 |
J Garfield (2005). A framework for teaching and assessing
reasoning about variablity. Statistics Education Research
Journal. |
|
17 |
31 |
J Waton (2005). Developing reasoning about samples. The
challenge of developing statistical literacy. |
|
18 |
30 |
S. Murray (2002). Preparing for diversity in statistics
literacy: Institutional-educational implications. Sixth
International Conference. |
|
19 |
27 |
I Gal (2003). Teaching for statistical literacy and
services of statistics agencies. The American Statistician, |
|
20 |
24 |
M. Schield (2004). Statistical literacy curriculum
design. IASE Curriculum Design Roundtable. |
|
20 |
24 |
JL Snell (1992). A course called chance. Chance |
|
22 |
23 |
M. Schield (1999). Statistical literacy: Thinking
critically about statistics. Of Significance |
|
22 |
23 |
I. Gall (2002). Statistical literacy: Conceptual and
instructional issues. Perspectives on adults learning
mathematics |
|
24 |
22 |
R. Callingham, J. Watson (2005). Measuring statistical
literacy. Journal of Applied Measurement |
|
24 |
22 |
I Gal (1995). Teaching Statistics. |
|
|
TOP
STATLIT-SITE PAPERS |
|
Papers downloaded from
www.StatLit.org in 2011.
Total downloads: (198,000 in 2011, 207,000
in 2010, 184,000 in 2009; 106,000 in 2008). Counts in parenthesis are (2011; 2010; 2009; 2008).
2011: The StatLit website hosts 811 pdfs including 198 pdfs of slides.
-
Percentage
Graphs in USA Today. Milo Schield 2006 ASA (19114; 10664; 13253; 14247;
8809). Inception to date:
67,077.
-
The Cult of Statistical
Significance by Stephen Ziliak and Deirdre McCloskey
2009 ASA 6up
4up (3160 3972; 999) -
Importance and Measurement of
Pre-Service Teachers' Efficacy to Teach Statistics...
2009 ASA Harrell et al. (1753[11]; 2506)-
Statistical
Literacy: A New Mission for Data Producers. Milo Schield 2011
SJIAOS (1723) [New in 2011]
-
Interpreting the substantive significance of multivariate
regression coefficients
by Jane Miller 2008 ASA
(1625[11]; 2094; 1412)
-
Statistics for Political Science
Majors. Gary Klass 2004 ASA (1389[10]; 596[6]; 765; 215)
-
Presenting Confounding Graphically Using Standardization
(1289; 2084; 1985; 1616).
Milo Schield, 2006 Draft for Stats magazine
-
Ambiguity
Intolerance: An Impediment to Inferential Reasoning?
Robert Carver 2006 ASA (1220; 624[5]; 797) -
Teaching Statistical Literacy as Quantitative Rhetoric. ASA 2010
John Schmit 6up (1187[9]; 279[2])
[New in 2010]
-
Some Difficulties Learning
Histograms. Carl Lee & Maria Meletiou-Mavrotheris ASA 2003
(1156[8]; 1792; 991; 1179)
-
Exploring Simpson's Paradox. Larry Lesser (Univ. Texas, El Paso) NCTM
2001 (1143[9]; 2043[11]; 2844; 913)
Number of months tracked in brackets [#] if less than 12. |
-
Assessing
Students’ Attitudes: The Good, the Bad, and the Ugly by
Anne Millar and
Candace Schau
2010 ASA. (1068[7]) [New in
2010]
-
The
Components of Numeracy. Ginsburg,
Manly & Schmitt 2006 NCSALL (975[7]; 1809[8]; 466; 235)
-
Three Paradoxes.
Howard Wainer and Lisa Brown, Nat. Board of Med. Examiners. Draft
American Statistician 2004 (913[9]; 1084[10]; 315; 750)
-
Social Mathematics in US Civics
Curriculum. James Mauch
dissertation 2005 (792[5]; 858[7]; 442; 470)
-
US Supreme Court Brief on
Statistical Significance by Debra McCloskey and Stephen Ziliak
(700[5])
[New in 2011] -
Developing
statistical literacy with students and teachers in the secondary
mathematics classroom. PhD Thesis. Doyle (597 [5]; 1811[9])
-
Statistical Literacy
Textbook: Introduction 2011 M Schield (577[4]; 1209[9])
-
Teaching Statistical Literacy using
Odyssey2Sense (TM): A Unique Web-Forum by
Milo Schield
2011 MAA. 6up
Poster (558
[4]) [New in 2011] -
What do M&M's, Dahlias, soil erosion
and data analysis across the curriculum have in common?. Jerry
Moreno 2006 ASA (547[4] ...)
-
Just Plain Data Analysis: Common
Statistical Fallacies.... Gary Klass (Illinois State University)
2008 ASA (502 [5]; 654[6]; 991; 499) -
People Count: The Social
Construction of Statistics. Joel Best 2002 Presented at ASA (467
[5]; 554[5]; 803; 1,087)
Excludes papers having less than 450 downloads. Excludes non-articles
such as Amazon lists, PowerPoint slides, reference documents (UTSQ-QEP.
Bracey principles, QR textbooks), pdf scans (1993 Weinberg)
and non-statistical articles (Freeminds).
|
|
TOP
STAT-LIT SITE-PAGES VIEWED |
Top StatLit Pages Viewed at
www.StatLit.org in 2011
(####; ####; ###; ###): page views in 2011, 2010; 2009; 2008.
-
Welcome (28,157, 23,159; 15,729; 10,423): Home
Page-
Standardizing (5,176; 3,265; 2,434; 1,718): Excel
displays.
-
Joel Best
(5,036; 4,794; 3,481; 3,118): Author
-
Adult Numeracy (4,998, 5,007; 2,467; 1,987)
-
StatLit Papers
(4,203; 3,131; 2,837; 2,444): Scholarly articles.
-
Howard Wainer (3,893; 2,778; 2,127; 1,966):
Author.-
StatLit News 2009
(3,228; 4,869)
-
Q/L Textbooks
(3,159; 2,741; 2,484; 2,387)
-
StatLit News 2008 (2,975; 3,333; 2,634)
-
StatLit News 2010
(2,963)
-
Gerd
Gigerenzer (2,567; 1,993*; 1,415; 1,503):
Author -
Gerald
Bracey (2,374; 2,655; 2,669; 2,035): Author-
Q/L Books
(2,305; 1,418; 1,459): Q/L-related books (not texts).
-
StatLit News 2007 (2,127; 2,552; 1,498; 1,928)-
Q/L Activities
(2,106; 1,725*; 1,278; 1,378): Q/L-related activities.
-
StatLit
News 2004
(1,738; 1,929; 1,191; 1,183) -
John Paulos (1,737*; 1,845; 1,669): Author of "Numeracy".-
StatLit News 2006 (910*[7]; 1,386; 1,523)
|
Total page views (including /GC):
(125,271, )
Page views as a percentage of Total:
Index (22%), Adult numeracy (4%), Joel Best (4%), Standardizing
(4%), Articles (3%) and Howard Wainer (3%). All the rest were less
except "Other" (22%).
New pages include Michael Blastland, John
Brignell, David & Phyllis Whitin, and Jeffrey Bennet.
Note: Website statistics are tabulated by
the DeepMatrix program LiveStats® .XSP V8.03. Each month, the views
for the top 25 website pages are tabulated. Those pages that
aren't in the top 25 that month are treated as having zero views.
* Pages with less than 12 months
statistics are indicated by the asterisk (no adjustment). Pages with
less than 9 months of statistics are omitted (except those that are
student assigned during certain months).
In 2011, the StatLit web site has 57
htm pages in the main directory. Others include student-assigned pages (/GC) and the
Keck Survey.
Navigation page views (2011; 2010;
2009; 2008) totaled (11,180; 9,716; 9,522; 8,474): Statistical
Literacy (3,046; 2,729; 2,396; 2,100), StatLit News
(2,162; 1,836;
1,928; 1,863), Authors (2,245; 1,980; 2,033; 1,860), Statistical
Reasoning (2,051; 1,617*; 1,625; 1,425) and
Numeracy (1,676*; 1,554*; 1,540; 1,226).
Student-assigned page-views
[all via /GC] were not totaled.
|
|
TOP
SITE SEARCH-PHRASES |
Top phrases in search referrals to
www.StatLit.org.
Search referrals (2011; 10; 09; 08; 07) References
shown are likely targets.
Search phrase totals (7,419; 14,022; 21,110)
-
Joel Best (238; 835; 1,147; 594):
See Joel Best author page. [Billie
Joel?]
-
graphs (171; 567; 654; 634): Schield
Percentage Graphs in USA Today
-
Howard Wainer (137; 424;340; 110): See
Howard Wainer
author page.
-
Statistical Literacy
(237; 341; 385; 249): See Statistical Literacy.
Includes "StatLit"
-
Quantity words (317; 547; 264): Schield, Why
Students Use 'Many'?
-
Data (111; 80)
-
Standardiz... (110; 240; 100; 131):
Schield, Adjusting for
Confounding Graphically.
-
Significance, substantial and statistical (110*; 168)
-
Numeracy and Math across curriculum
(57*; 197; 75; 60): See Numeracy
|
-
Gerd Gigerenzer (44*; xxx)
-
quantitative reasoning (28*; 22; 33):
See Numeracy or Q/L -
Simpson Paradox
(19*; 45; 59; 54): Schield, "Adjust for
Confounding Graphically".
-
Social construction and ambiguity (13*; 38): See
Schield, Teaching the Social
Construction of Statistics
-
Gerald Bracey (13*; 214; 94): See
Gerald Bracey author page.
Each month, LiveStats ranks the search
terms used and captures the top 20 with the associated number of
referrals. In 2011, this generated over a hundred unique
search terms with 1,851
visits (plus 5,568 Other) for a total of 7,419 total search
referrals. These search terms were grouped by search phrase
(so 'standardizing' and 'standardized' were counted together) into
45 groups. Note that these numbers are very sensitive to
how search terms are grouped into search phrases. Note that
most of the search
referrals are tabulated under Other.
|
|
GOOGLE SITE RANKINGS |
|
Google rated www.StatLit.org as the #1 site for Statistical Literacy for the
7th year. Google ranking (12/18/2011) of
www.StatLit.org.
When two words are shown, they
are searched as a phrase.
#1: Statistical literacy, Joel
Best, Howard Wainer, Othmar Winkler,
statistical prevarication, chance grammar, percentage graphs, spurious
association, statistical doublespeak.
Top 5: Dennis Haack (2), David Phyllis
Whitin (2), percentage grammar (3), Marc-Isaacson statistics (3), standardizing (4), adult numeracy (4), social construction statistics (4), data literacy (4), statistical paradoxes (4), statistically literate (4),
Lynn Steen (5), Milo
Schield (5).
Top 10: Gerald
Bracey (6), Jane-Miller statistics (6),
Gigerenzer (7), John Paulos (7), interpreting doublespeak (8), Bernard Madison (10).
|
Top 30:
Simpson's paradox (12),
statistical
reasoning (12), statistical illiteracy (15), multivariate thinking (18), statistically illiterate (19),
USA Today graphs (21), numeracy (21).
Top 50: quantity words (35),
statistical education (36), journalistic significance (38),
confounder (43).
This site was not in the first 50 for chance, confound,
confounded, confounding, critical thinking, effect size, financial literacy, graphs, health literacy, health numeracy, induction,
information literacy, innumeracy, interaction,
Jane Watson, Katherine Wallman,
quantitative literacy, quantitative
reasoning, randomness, significance,
social construction, spurious, standardization, statistics
or Take care.
Process: Search on phrase (in quotes); Find first instance of
statlit.org or Augsburg.edu/ppages/~schield [except for Milo Schield].
|
|
TOP 10 REFERRAL DOMAINS |
|
Visits by Referral Domain.
Data (2011; 2010). Total (46,742; 61,557) Other (9,933; 8,563)
#0: www.dailyspeculations.com
[linked to a picture] (857; 11,393)
#1:
www.google.com (12,693; 10,510)
#2: ilt.ilstu.edu or
pol.illinoisstate.edu (10,761; 8,563)
#3: www.google.co.uk
(1,488; 1,263)
#4: www.google.co.in
(1,342; 1,040)
|
#5:
www.bing.com (1,173; 1,056)
1,165
#6:
www.google.ca (1,023; 833)
#7: www.analyticbridge.com
(920, xxx)
#8: search.yahoo.com
(792; 724)
#9 www.google.com.au
(702; 600)
#10: scienceCampaign.org.uk (442, xxx)
|
|