Solid Growth in 2008:
-
Grant funding continues: over $2 million for
numeracy-related projects.
-
StatLit.org 2008 traffic up 20% on visits, 60%
on downloads and 65% on referrals: 101,000
visits, 102,000 downloads and 18,000 referrals.
|
Top New Books
-
StatSpotting: Joel Best
-
Just Plain Data Analysis: Gary
Klass
-
Calculation vs. Context: Edited
by B. Madison and L. Steen
-
Know Your Chances:
Understanding Health Statistics: Steven Woloshin and Lisa
Schwartz
-
Government Statistical Offices &
Statistical Literacy: Juana Sanchez, Ed.
-
The Cult of Statistical
Significance: McCloskey and Ziliak
|
|
NUMERACY (NNN):
NEW JOURNAL |
|
Numeracy is an open-access, peer-reviewed
journal launched in 2008. Numeracy aims to support
education at all levels that integrates quantitative skills across
disciplines. The journal seeks evidence-based articles. See Vacher's
NECQL and
PKAL presentations. |
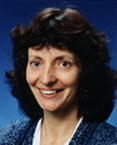
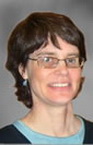
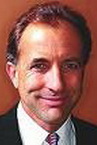
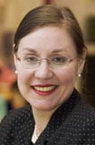
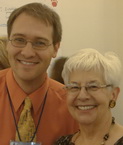
Len Vacher (left) and Dorothy Wallace (right)
are editors of Numeracy: Advancing Education in Quantitative
Literacy. Numeracy is published by the National
Numeracy Network, supported by the U. of S. Florida Libraries and hosted
by
the Berkeley Electronic Press™. |
|
|
|
|
|
|
Joel Best's
Stat-Spotting: A Field Guide to Identifying Dubious Data
is a "field guide to
identifying dubious data." "It lists common problems found in the
sorts of numbers that appear in news stories and illustrates each
problem with an example. This guide tries to organize them around
a set of practical questions you might ask when encountering a new
statistic." |
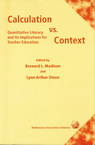 Calculation
vs. Context Calculation
vs. Context
Quantitative Literacy and Its' Implications
for Teacher Education. Ed.: Bernie Madison and
Lynn Steen. Articles by Richard Shavelson. Robert
Orrill, Neil Lutsky, Milo Schield, Alan Tucker, Corrine Taylor, Joel
Best, Hugh Burckhardt and Frank Murray. Contents
available online. To buy, search
MAA bookstore under
Quantitative Literacy or
Teaching
& Education. |
|
By Gary Klass
(2008, 186 pgs $22pb)
Just Plain Data Analysis: Finding, Presenting, and Interpreting Social Science Data. "Teaches students statistical literacy skills
used to evaluate and construct arguments about public affairs grounded
in numerical evidence. These practical skills involve finding,
presenting, and interpreting commonly used social indicators..." |
By
McCloskey and
Ziliak (2008,
352 pgs, $17). The Cult of Statistical Significance: How the Standard Error Costs Us Jobs, Justice, and Lives (Economics, Cognition, and Society)
"The quest for statistical significance ... is a deeply flawed substitute for thoughtful analysis. . .
. Yet few participants... have been willing
to admit ... that the emperor has no clothes.” |
|
by
Ronald R. Gauch (298 pgs 2008hc, $60). It's Great! Oops, No It Isn't: Why Clinical Research Can't Guarantee The Right Medical Answers "dissects medical research methodology and
... explains why correct answers are so hard to achieve." Shows why
"medical researchers can never be sure that they’ve ended up with a
truthful answer." |
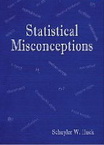 Statistical
Misconceptions Statistical
MisconceptionsBy
Schuyler Huck (2008, 300p). Statistical Misconceptions
"helps
readers identify and...discard 52 misconceptions about data and
statistical summaries. The focus is on major concepts contained in
typical undergraduate and graduate courses in statistics, research
methods, or quantitative analysis. Fun interactive ... exercises ... are found on the book's website." |
|
By
Joan B. Garfield and
Dani Ben-Zvi: Developing Students Statistical Reasoning: Connecting Research and Teaching Practice ($219). "Increased attention is being paid
to the need for statistically educated citizens... Increasing the
amount of instruction is not sufficient to prepare statistically
literate citizens. A major change is needed in how statistics is
taught." |
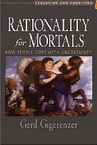 Rationality
for Mortals Rationality
for Mortals
By Gerd Gigerenzer (2008, 256 pgs, hc. $52). Rationality for Mortals: How People Cope with Uncertainty
"examines the rationality of individuals not from the perspective of
logic or probability, but from the point of view of adaptation to the
real world of human behavior... Seen from this perspective, human
behavior is more rational than it might otherwise appear." |
|
Edited by
Charles Lance and
Robert Vandenburg. Statistical and Methodological Myths and Urban Legends: Doctrine, Verity and Fable in the Organizational and Social Sciences
reviews "commonly undertaken methodological and
statistical practices that are sustained, in part, .. upon unfounded
lore. Historically, there is a kernel of truth to...these
legends, but...has been long forgotten." |
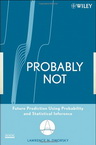 Probably
Not... Probably
Not...
By
Lawrence N. Dworsky (2008, 310 pgs,
$54pb). Probably Not: Future Prediction Using Probability and Statistical Inference. "organized
around easy-to-follow examples that address the role of probability ... in real-life situations. Fun-to-solve problems including "the
shared birthday" and "the prize behind door 1, 2 or 3" are found
throughout the book" |
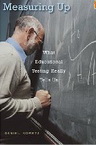 Measure
Up: Educational Tests Measure
Up: Educational TestsBy
Daniel
Koretz. (2008, 368 pgs, $24hc). Measuring Up: What Educational Testing Really Tells Us
is inspired by a popular Harvard grad course. Measuring Up
demystifies educational testing—from MCAS to SAT to WAIS, with all the
alphabet soup in between. Bringing statistical terms down to earth,
Koretz takes readers through the most fundamental issues.
Interview. |
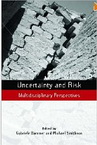 Uncertainty and Risk Uncertainty and Risk
By
Gabriele Bammer and
Michael Smithson (2008,
200 pgs, $97hc). Uncertainty and Risk: Multidisciplinary Perspectives (The Earthscan Risk in Society Series)
Reviews: "The most thorough examination of ‘uncertainty,’ the core
concept in risk theory and management." Covers a wide range of
perspectives, practice and problems." |
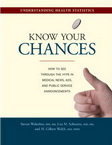 Know
Your Chances -- Health Know
Your Chances -- HealthBy
Woloshin et al. (2008, $12). Know Your Chances: Understanding Health Statistics
is a lively book that helps consumers to interpret the numbers
and take the mystery out of medical statistics. By learning ...the medical statistics and knowing what questions to ask,
readers will ... see through the hype and find out what...credible information remains. |
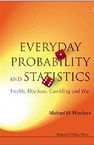 Everyday
Probabilities Everyday
Probabilities
By
Woolfson (223 pgs, 2008, $43hc). Everyday Probability and Statistics: Health, Elections, Gambling and War
presents the important results of probability and statistics without
heavy mathematical demands. Enables an intelligent reader to
assess statistical information and to understand that the same
information can be presented in different ways |
|
Edited by Reder/Bynner (2008, $108). Tracking Adult Literacy and Numeracy Skills: Findings from Longitudinal Research (Routledge Research in Education)
"examines the origins
of poor literacy and numeracy skills in adulthood as well as what can be
done to improve them. The editors bring together the results of
longitudinal studies that greatly extend our knowledge." |
By Andrew Hodges (2008, 304 pgs. HC). One to Nine: The Inner Life of Numbers
"A
virtuoso stream of consciousness containing everything important there
is to say about numbers... Cogent, charming and deeply personal. . .
. One to Nine makes the unfathomable enticing and gives the reader
tremendous motivation to explore further." —Daily Telegraph (UK) |
|
By Eric J. Seidman (2008, 252 pgs, $15). Bridging the Statistical Gap
"combines the teaching style of
introductory books with the research techniques of advanced publications
in order to serve as a [baseball] fan's first foray into sabermetrics."
"Sabermetrics is the analysis of baseball through objective evidence." [Wikipedia]
|
 Guess-ti-mation
on a Napkin Guess-ti-mation
on a Napkin
By
Lawrence Weinstein and
John Adam. (2008,
304 pgs. HC). Guesstimation: Solving the World's Problems on the Back of a Cocktail Napkin
. "instills the beauty and power of the
back-of-the-envelope calculation. Never again will you take a newspaper
figure at face value without feeling the need, and confidence, to
guesstimate your own figure." (Matthew Killeya, New Scientist ) |
|
By Leonard Mlodinow (2008, 272 pgs, $17hc).
The Drunkard's Walk: How Randomness Rules Our Lives. "Books on
randomness and statistics line library shelves, but Mlodinow will help
readers sort out Mark Twain's damn lies from meaningful statistics and
the choices we face every day." "readable guide to how the ... laws of
randomness affect our lives." Stephen Hawking |
 Randomnicity Randomnicity
By
Anastasios Tsonis (2008, 200 pgs, $58hc). RANDOMNICITY: Rules and Randomness in the Realm of the Infinite
identifies "three sources of randomness: randomness due to
irreversibility which inhibits us from extracting whatever rules may
underlie a process, randomness due to our inability to have infinite
power (chaos), and randomness due to many interacting systems." |
|
by
Dan Ariely (2008, 304 pgs, hc $17). Predictably Irrational: The Hidden Forces That Shape Our Decisions. "The most difficult part of
investing is managing your emotions. Dan explains why that is so
challenging for all of us, and how recognizing your built-in biases can
help you avoid common mistakes." Charles Schwab, Chairman and CEO. |
 Unlatching
the Gate Unlatching
the GateBy
Katherine Safford-Ramus (188 pgs, 2008pb). Unlatching the Gate
was written for the adult education and postsecondary
mathematics educators who teach adults studying mathematics in the
U.S. This book would be ideal for a graduate course or
seminar in adult mathematics education or as outreach via a distance
learning course or instructor study circle. |
|
Ben Goldacre (2008 352 pgs, Import/pb)
has a crusade against lazy and deceptive writing about science. In Bad Science,
he
argues that the inability of the press and public to evaluate evidence
has become a public health issue.
Review Read his blogs on his
Bad Science website. |
 Outliers: The Story of Success Outliers: The Story of Success
By Malcolm Gladwell (2008, 303pgs, $20pb). Outliers: The Story of Success
poses a question: why do some people succeed, living remarkably
productive and impactful lives, while so many more never reach their
potential? Challenging our cherished belief of the "self-made man," he
builds a convincing case for how successful people rise on a tide of
advantages.
|
|
by
Federica Russo. Causality and Causal Modelling
in the Social Sciences: Measuring Variations
"argues that causal models are regimented by
...variation...thus
breaking down the ...Humean paradigm. The notion of variation is shown
to be embedded in the scheme of reasoning behind various causal models:
e.g. Rubin’s model, contingency tables, and multilevel analysis.." |
By
Ruth Groff (2008, $133). Revitalizing Causality: Realism about Causality in Philosophy and Social Science (Routledge Studies in Critical Realism)
This cutting edge collection ... addresses just what it means to invoke
causal mechanisms ... in...offering a causal explanation ...helping to stake out a new, neo-Aristotelian
position within contemporary debate. |
|
by
Daniel Kaplan. "introduces and illuminates the statistical
reasoning used in modern research throughout the natural and social
sciences, medicine, government, and commerce. It emphasizes the use of
models to untangle and quantify variation in observed data. By a deft
and concise use of computing coupled with an innovative geometrical
presentation of the relationship among variables, ..." |
By Danny Kaplan (left). A
Fresh Approach reveals the logic of statistical inference and empowers
the reader to use and understand techniques such as analysis of
covariance that appear widely in published research but are hardly ever
found in introductory texts. [Added 2012] |
|
by
David Owens. "proposes that coincidences have no causes, and
that a cause is something that ensures that its effects are no
coincidence." "causal facts can be analyzed in terms of non-causal
facts, including relations of necessity. ... causation is defined in
terms of coincidence, and coincidence without reference to causation."
"challenges ideas of Hume, Davidson and Lewis"[2013] |
By Vikas Khatri. "A chronicle
of occurrences encompassing myriads of people, including Jefferson,
Lincoln, Hitler, Stalin, Charlie Chaplin, Arthur Conan Doyle, Kennedy,
Reagan and footballer Pele." Paperback: 126 pages.
Publisher: Pustak Mahal. |
|
MORE OR LESS: BBC |
|
"an idea born of the sense that numbers were
the principal language of public argument. And yet there were few places
where it was thought necessary to step back and think - in the way we
often step back to think about language - about the way we use figures:
what they really measure, what kind of truth, if any, they capture."
First presented by Andrew Dilnot (left). |
 Blastland
Primer on Statistics Blastland
Primer on Statistics
In 2008, Michael Blastland (left) presented a
six-part primer on understanding statistics in the news on the BBC.
Lesson
1: Surveys;
Lesson
2: Counting;
Lesson 3:
Percentages;
Lesson
4: Averages;
Lesson
5: Causation and
Lesson
6: Doubt. Michael Blastland and Andrew Dilnot were,
respectively, creator and presenter of the BBC Radio 4 series on
numbers, More or Less." |
|
In 2007, Michael Blastland and Andrew Dilnot
co-authored
The Tiger That Isn't: Seeing Through a World of Numbers
" "Numbers
saturate the news, politics, life. for good or ill, they are
today's pre-eminent public language -- and those who speak it rule...
But they are also hated and often for the same reasons. They can
bamboozle not enlighten..." See also
The Numbers Racket. |
In 2008, Michael Blastland and Andrew Dilnot
co-authored
The Numbers Game: The Commonsense Guide to Understanding Numbers in the News, in Politics, and in Life. "The Strunk
& White of statistics team up to help the average person navigate the
numbers in the news." Concise chapters on size, chance, averages,
targets, risk, measurement, and data. |
|
GENERAL NEWS |
|
The Royal Statistical Society (RSS)
announced today (Oct 17, 2008), that it has selected the University
of Plymouth as the
new
home for the Centre for Statistical Education. The university
secured the contract to host this prestigious centre against very
stiff competition. The centre works to promote the improvement of
statistical education, training and understanding at all ages. |
Real Education: Four Simple Truths for Bringing America's Schools Back to Reality
by Charles Murray (2008, 228pgs, $17hc).
"Widespread statistical illiteracy... is cause for immediate concern
because none of us...has time to
assess the data independently... We all have to rely on the
quality of information we get from the media-and, as of today, that
quality is terrible." |
|
By ACT (2008). Among ACT test takers, 57% lack readiness for
college algebra. By race: 37% of Asians, 51% of whites, 74% of
Hispanics, 75% of American Indians and 89% of blacks. By preparation:
26% of those taking Calculus, 62% of those taking Geometry, Algebra 2
and Trig, and 86% of those taking just Algebra 2 and Geometry.
College readiness is the minimum score needed on an ACT subject-area
test for a 75% chance of obtaining a C or higher in the corresponding
course. |
33% of children in California will not finish high school.
Disadvantaged students in the first grade have a vocabulary that is
approximately half that of an advantaged student (2,900 vs. 5,800).
More than three out of four of those on welfare, 85% of unwed mothers
and 68% of those arrested are illiterate. About three in five of
America's prison inmates are illiterate. Approximately 50
percent of the nation's unemployed youth age 16-21 are functional
illiterate. |
|
How Valid Are T.V. Weather Forecasts by J.D. Eggleston was
contained in the
Freakonomics column in The New York Times. Adam Hersch,
Globalize This, panned this analysis as an example of
statistical illiteracy. "my point was that the blog author ...
perpetuated fundamental misconceptions about the nature of probability
and forecasts. Not to mention vilifying television weather forecasters." At issue is how to measure the quality of probabilistic predictions. |
Journalist gets statistics backward; guilty of
the confusing the inverse.
A
New York Times journalist said "at Stuyvesant...2 percent of blacks,
3 percent of Hispanics, 24 percent of whites and 72 percent of Asians
were accepted. He
should have said "among those accepted at Stuyvesant...2 percent are
blacks, 3 percent are Hispanics, 24 percent are whites and 72 percent
are Asians." |
|
By James Trefil (George Mason Univ.). "the main problem with general
education in the sciences is that we have set ourselves the wrong goal.
Rather than thinking about the problem of producing miniature scientists,
let me advance .... an alternate goal: Students should be able to read
the newspaper on the day they graduate.... we
[should] think about the way our students will use their science education in
later life, and then adopt goals that support those uses." |
By
Chad Orzel. "Inside Higher Education" 8/20/08. "I think the
lack of respect for math and science is one of the largest
unacknowledged problems in today’s society. And it starts in the academy
— somehow, we have moved to a place where people can consider themselves
educated while remaining ignorant of remarkably basic facts of math and
science. It simply should not be acceptable for people who are ignorant
of math and science to consider themselves Intellectuals" |
|
The Collegiate Learning Assessment (CLA) is an innovative approach to
assessing your institution’s contribution to student learning developed
by CAE with the RAND Corporation. Our measures are designed to simulate
complex, ambiguous situations that every successful college graduate may
one day face. Tested skills include critical thinking, analytical
reasoning, problem solving and written communication. Specific
skills include "understand data in tables and figures." |
When the difference between two candidates is
not statistically significant, is this a statistical tie?
Mano Singham and
Nick Beaudrot says "No!"
They reference
Kevin Drum. This issue was raised by Douglas Lonnstrom at IASE
in 2001,
Statistical Dead Heat and the Mass Media.
The issue is whether or not to start with a null hypothesis. {Should
political polls and clinical trials have different standards just
as do civil and criminal law? Ed.} |
|
|
|
The
NSF
awarded TERC (Cambridge, MA) $1,965,674
to fund "Statistics For Action": a project involving "informal
science education." Mary Jane Schmitt and Martha Merson
are co-PIs. Deliverables include bilingual, print- and web-based
instructional materials for environmental
organizations to use with staff and community members.
TERC is partnering with the Toxics
Action Center to enhance the capacity of environmental organizations to
teach mathematical literacy skills to low-income citizens, mostly women
of color. The project is (1) developing math- and statistics-rich
educational materials that help non-scientists interpret environmental
test results, (2) developing training materials that help environmental
organization personnel provide Q/L training to
citizens, ... |
The
NSF
awarded the Univ. of Michigan a $369,932 Phase 3 CCLI grant titled "Infusing Quantitative Literacy throughout
the Social Science Curriculum."
Bill Frey and William Alter are co-PIs.
Bill Frey is Director of the
Social Sciences Data Analysis Network (SSDAN)
and author of
America by the Numbers.
The primary project activities are
creating, disseminating, and assessing teaching materials that make it
easy for instructors to integrate data analysis in non-methodology
courses. The goal is to reduce the "quantitative reasoning gap" between
what students learn in early courses and the importance of empirical
research in the social sciences. A second goal of the project is to
recruit experienced faculty members to develop new tools for assessing
student learning and to conduct assessments in their classes. |
|
In 2008, the
NSF
awarded the Univ. of S. Florida $197,688 in a CCLI-Phase 1 grant.
Len
Vacher (left) is PI along with
Rains, Iverson, Juster and Harden. This project promotes Quantitative
Literacy and a form of scientific literacy - the
"science-in-action" realization that data-based science is crucial in
making decisions that society cares about." |
The
NSF
awarded the University of Wisconsin $99,924 to fund "Development of
Conditional Probability Judgments" with
Charles Kalish (Math) as PI.
Conditional probability judgments are involved when interpreting
statistical claims. By
under-standing how children approach conditional probability we
can design more effective instruction to improve scientific
literacy. |
|
The
NSF
awarded the Univ. of Missouri St. Louis $1,651,166 for "Science
Literacy through Science Journalism."
Joseph Polman is
PI. The project approaches science journalism as a means to assist
students to investigate and coherently write about contemporary science
and to learn to base assertions and descriptions on reliable, publicly
available sources. |
In 2008, the
NSF
awarded the Algebra Project $717,451 for "R&D: The Development of
Student Cohorts for the Enhancement of Mathematical Literacy in Under
Served Populations "
Robert Moses (left) is PI. Cohort students
commit to take mathematics classes every day for 90 minutes for four
years and to use Algebra Project materials
|
QUOTES: Quantitative Literacy |
QUANTITATIVE LITERACY
QR is less about the manipulation of numbers than it is about the
evaluation and construction of arguments. Neil Lutsky,
Illuminating Arguments with
Numbers.
Quantitative literacy faces two
challenges: first, recognizing that Q/L must encompass more than matters
of calculation, and second, finding ways to integrate Q/L -- and critical thinking more
generally -- into the curriculum. Joel Best, Calculation
vs. Context
If QL is not taught in Mathematics, it will not happen.
Hugh Burckhardt, Calculation
vs. Context
Mathematicians are
least-well prepared to deal with the meaning of socially-constructed
numbers, which is the essence of QL.
Neil Lutsky, Calculation
vs. Context
"Numeracy ... is the ability to comprehend, use and attach meaning to
numbers." Nelson et al, Clinical Implication of Numeracy,
Annals of Behavioral Medicine 2008
The teaching of mathematics K-16 ... has not met the challenge of
creating a quantitatively literacy citizenry. Richard
Shavelson, Calculation
vs. Context
There is a "serious mismatch between the
quantitative demands that US society places on its citizens and the
quantitative education made available.
Bernie Madison
Lasting change begins with a clear conception of the measurable
features of numeracy. Frank Murray, Calculation
vs. Context
SCHOOL MATH
Students who complete Algebra II are more than
twice as likely to graduate from college compared to students with less
mathematical preparation. A major goal for K–8 mathematics education
should be proficiency with fractions (including decimals, percents, and
negative fractions), for such proficiency is foundational for algebra and,
at the present time, seems to be severely underdeveloped. The
most important foundational skill not presently developed appears to be
proficiency with fractions (including decimals, percents, and negative
fractions). The teaching of fractions must be ... improved
before an increase in student achievement in algebra can be expected.
National Mathematics Advisory Panel.
Introduce rates and
percentages as presented in tables and graphs in middle school as a
pre-Algebra bridging course.
Milo Schield, Calculation vs.
Context
Introduce a quantitative literacy course or a statistical literacy course
[as an alternative to Algebra II].
Milo Schield, Calculation vs.
Context
|
|
|
 SENCER:
Q/L and Projects SENCER:
Q/L and Projects
SENCER: Science Education for New Civic
Engagements and Responsibilities. Incorporates SENCER strategies
into an existing general education course (Math 102-Quantitative Skills
for the Modern World) that is required for all students at Loyola
Marymount Univ. except those in quantitative majors. By Zachariah,
Larson & Dewar (Loyola Marymount U.) |
 SENCER:
Statistics with Civics SENCER:
Statistics with Civics
By Cindy Kaus (2008, Metropolitan Univ., MN).
"Key statistics concepts, such as probability, regression,
distributions, outliers, correlation and statistical significance, are
taught "through" issues of civic importance, such as voting results, the
death penalty, drug use, or unemployment. Lectures are combined with ...
a community-based group project... |
|
|
 Quant. Methods for Comm. Quant. Methods for Comm.
By Wrench, Thomas-Maddox, Richmond and
McCroskey (2008, 304 pgs, $30). Quantitative Research
Methods for Communication: A Hands-On Approach is an introductory
textbook on the fundamentals of communication research. Includes the
three most common techniques: survey, content analysis, and experiment. |
 Quant.
Research in Commun. Quant.
Research in Commun.
Edited by Michael Allen, B. Scott Titsworth
and Stephen Hunt. (2008, 256 pgs pb. $37).illustrating how
particular research methods can be used to answer very practical,
civic-minded questions. illustrate how statistical procedures are
used in a wide variety of contexts, such as tsunami warnings, date
requests, and anti-drug public service announcements. |
 Quant.
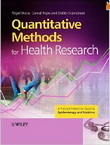
Methods for Health Quant.
Methods for Health
By Nigel Bruce, Daniel Pope and Debbi
Stanistreet (9/2008). Quantitative Methods for Health Research:
A Practical Interactive Guide to Epidemiology and Statistics ($115)
"is a practical, interactive course in epidemiology and statistics,
designed to achieve a level of knowledge and skills appropriate to a
masters in health sciences, public health ..." |
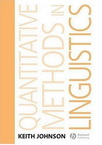 Quant.
Methods in Linguistics Quant.
Methods in Linguistics
By Keith Johnson. (2008, 296 pgs, $88).
"This rich and rewarding textbook is a must-read for all students and
researchers who wish to follow the new wave of sophisticated empirical
models and methods now sweeping the field of linguistics from phonetics
to syntax and semantics." Joan Bresnan, Stanford University. Uses
R for statistical analysis. |
|
By Stephen DeMeo (2008, 304 pgs, $30,
textbook). Multiple Solution Methods for Teaching Science
in the Classroom: Improving Quantitative Problem Solving Using
Dimensional Analysis and Proportional Reasoning. These two
methods are used to enhance conceptual understanding while solving
problems in biology, chemistry, physics, and earth science. |
By
Dawn Griffiths (2008). Brings statistics to life, teaching you
everything you want and need to know about statistics through engaging,
interactive, and thought-provoking material, full of puzzles, stories,
quizzes, visual aids, and real-world examples. Ideal for
high school and college students; satisfies AP Stats requirements. |
RESOURCES and REFERENCES |
|
The May 2008 issue of
Focus on Basics is on
Numeracy with Numeracy
Matters by Myrna Manly and Using Part-Whole Thinking in Math
by Dorothea Steinke. {Study the sections on Understanding
Relationships and New Model for Word Problems for a
fascinating presentation on the development of part-whole understanding
in children and their central status in mathematics. Ed.} |
Data-Planet’s easy-to-use desktop tool lets
you quickly access and instantly compare over 30 Million time series
(over 7 billion data points) from hundreds of sources and millions of
metrics. Powered by WebCEO: a new way to turn data into knowledge.
$2,895/yr with academic discounts available. See also
Lexis-Nexis DataSets. See
Coyle's slide presentation at NNN. |
|
New 2008. "the site that tries to make sense
of chance, risk, luck, uncertainty and probability. Mathematics won't
tell us what to do, but...understanding numbers can help us deal with
our own uncertainty and allow us to look critically at stories in the
media." Cambridge Statistical Lab. Check out "life
tables." Select Behavior tab; select sex, age & behaviors
to see future. |
"ICPSR's Online Learning Center (OLC)
supports quantitative literacy in the social sciences by providing an
effective and reliable means of bringing data into the classroom." Our
"Data-Driven Learning Guides are designed for in-class presentation or
as supplemental activities ... demonstrating a variety of types of ...
analysis and substantive concepts."
Lynette Hoelter (staff) |
|
By
Mike Bryon (2008, 224
pgs, $13). How to Pass Advanced Numeracy Tests: Improve Your Scores in Numerical Reasoning and Data Interpretation Psychometric Tests.
"Pitched at a more advanced "graduate" level, it has much to offer the
beginner. Testing areas covered include quantitative reasoning, data
interpretation, and business judgment [with data sufficiency]." |
|
|
Journal
of Quantitative Analysis in Sports focuses on quantitative analysis
of all sports (e.g., to measure player performance and project
performance between leagues). This Journal is a publication of
Berkeley Electronic Press (bepress)
and is indexed in Intute, MathSciNet, RePEc, SPORTDiscus, Technology
Research Database (CSA), and Zentralblatt MATH. |
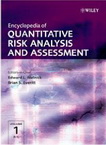 Encyclopedia
of Risk Analysis Encyclopedia
of Risk Analysis
The Encyclopedia of Quantitative Risk Analysis and Assessment
is edited by Edward L. Melnick and Brian S. Everitt (2,176 pgs.,
$1,190HC). Materials "on drug safety, investment theory, public policy
applications, transportation safety, public perception of risk,
epidemiological risk, national defence and security, critical
infrastructure, and program management. "
|
NEW ARTICLES/REPORTS |
|
 Health:
Statistical Illiteracy Health:
Statistical Illiteracy
Helping Doctors and Patients Make Sense of
Health Statistics by
Gerd Gigerenzer, Wolfgang Gaissmaier, Elke Kurz-Milcke, Lisa
Schwartz & Steve Woloshin (2007). Provide evidence that statistical
illiteracy (a) is common to patients, journalists, and physicians; (b)
is created by nontransparent framing of information and (c) can
have serious consequences for health. |
|
|
 Math
for Success [at School] Math
for Success [at School]
The
National Mathematics Advisory Panel (Dr. Larry Faulkner, Chair)
concluded that "The most important foundational skill not
presently developed appears to be proficiency with fractions" and
"The teaching of fractions must be acknowledged as critically important
and improved before an increase in student achievement in algebra can be
expected."
See:
#1,
#2 p.8,
#3 |
 Current
Practices Distort Current
Practices Distort
In "Why
Current Publication Practices May Distort Science"
Neal Young,
John Ioannidis (above) and
Omar Al-Ubaydli
(right)
note that "scientific information is an economic commodity, and that
scientific journals are a medium for its dissemination and exchange.
Economic modelling of science may yield important insights." |
Yu-Kang
Tu (pictured), Gunnell and Gilthorpe published "Simpson's Paradox, Lord's
Paradox, and Suppression Effects are the same phenomenon – the reversal
paradox" -- "depending on whether the outcome and explanatory variables are
categorical, continuous or a combination of both." For more, see Wainer (2004),
Tu
(2005) and
Tu (2007).
|
 Folk
Numeracy Folk
Numeracy
by Michael Shermer (2008). "Folk
numeracy is our natural tendency to misperceive and miscalculate
probabilities, to think anecdotally instead of statistically, and to
focus on and remember short-term trends and small-number runs."
"Given enough opportunities, outlier anomalies — even seeming miracles —
will occasionally happen." |
|
 Fuzzy
Trace Theory Fuzzy
Trace Theory
A Theory of
Medical Decision Making and Health: Fuzzy Trace Theory (2008) by
Valerie
Reyna, Cornell University. See also
How People Make Decisions That Involve Risk (2004),
Numeracy and Health by Eric Wago and "The importance of
mathematics in health and human judgment: Numeracy, risk communication,
and medical decision making" by Reyna and Brainerd.
|
Numeracy, ratio bias, and
denominator neglect in judgments of risk and probability by
Valerie
Reyna (left) and
Charles Brainerd
(right) in Learning and Individual
Differences 18 (2008) 89-107. Comprehensive overview. Identifies plausible psychological
mechanisms for adult difficulties with ratios. See
also Risk and Rationality in Adolescent Decision Making (2006)
Reyna & Farley. |
|
|
|
Corri Taylor, President, convened the
annual meeting of the National Numeracy Network (NNN) at Colby-Sawyer on May 15.
Bernie Madison is the founder and President Emeritus of NNN. Board
members are David Bressoud (Macalester), Neil Lutsky (Carleton), Caren Diefenderfer
(Hollins), Eric Gaze (Alfred Univ.) and John Jungck (Beloit). Milo Schield is vice-President. |
Laurie Snell
reviewed the Chance project:
its origin, goals, and outcomes.
See his "Using Chance Media to Promote
Statistical Literacy." "In a typical class, we ... read an
article in the current news that uses concepts of probability or
statistics and answer a two or three discussion questions." Laurie
is looking for an organization or individual to operate the Chance
website. |
|
Eric
Gaze (Alfred University) presented What Numeracy can Learn from Theories of Literacy at the 2008
National Numeracy Network annual meeting. He focused on the
importance of ratios and the argued that there was a need for an "industry standard" on the
basic Q/L tool set. Slides. |
Milo
Schield (Augsburg College) presented
Analyzing Numbers in the News: A Structured Approach at the 2008 National Numeracy Network
annual meeting. Slides.
He argued that news-based courses should give students a structure to
analyze arguments.
He compared questions raised by Neil Lutsky and Gerald Bracey
with those used in the W. M. Keck Statistical Literacy Project. |
|
Daniel Coyle (LexisNexis) presented LexisNexis Statistical DataSets: a
teaching tool that aggregates 120 databases in one user-friendly
interface. "Instantly access statistical information from 5.3 billion
data points with this dynamic new tool."
Take a Tour! |
Glenn Sproul (Johnson State) presented "Developing
a QR program: getting from hostility to acceptance and faculty buy-in"
at the NNN annual meeting.
His presentation included "A Brief History of Quantitative
Reasoning at Johnson State College." Transparencies. |
Q/L Workshops |
|
Semra Kilic-Bahi (right) chaired the 12th Annual Meeting of the North
East Consortium on Quantitative Literacy (NECQL)
May 17 at Colby-Sawyer. In Refocused
College Algebra – A Basis for Q/L, Don Small noted that such a
course "emphasizes creative problem solving [which] is central to Q/L."
Priscilla Bremser
presented
Mathematics, for, and of, social
justice.
|
The
Writing with Numbers Workshop featured Mya Poe (right) who presented
"Storyboarding With Data: Using
Quantitative Reading to Teach Research Writing."
6up. Heather Tompkins and
Paula Lackie (Carleton College) presented "What's
On-Line and What's on Campus to Support Student Writing with Numbers?" |
|
In Illuminating Arguments with Numbers, Neil Lutsky argues that "QR
is less about the manipulation of numbers than it is about the
evaluation and construction of arguments" and we should
"encounter numbers in the context of arguments." This is
a 28 slide version of the original 46 slide version. Boersma, Diefenderfer and Madison presented "Calculations in Context" |
In The Published
Numeracy Network (4up,
1up), Len Vacher (left) and
Todd
Chavez introduced the web of science (Science Citation Index) and
HistCite graphs showing
the citation history of papers contained in the web of science.
"Think of your new discipline as a new silo with pervious boundaries."
Mya Poe presented "Integrating Writing
and QR in Disciplinary courses." |
|
|
|
  PKAL@Carleton PKAL@Carleton
Project Kaleidoscope (Jeanne Narum,
PKAL Director) and Carleton's Quirk project (Nathan Grawe, Director)
co-sponsored this conference at Carleton College).
Project Agenda. Project facilitators.
Project workshop
schedule. |
Donna Sundre
(Professor and Executive Director of the
Center for Assessment and Research Studies at James Madison University)
gave an invited slide presentation:
The Challenges of Quantitative Reasoning Assessment. Donna
also gave a slide presentation on "The
James Madison Story." See
Assessment and
Quantitative
Reasoning test. |
|
In March, Nathan Grawe (Carleton) presented
slides: "Assessing Quantitative Reasoning in Student Writing: A
QuIRKy Experience" to the New England Educational Assessment
Network. This included a review of Q/R assessments and details on
Carleton's QUIRK assessment strategy. {This is an outstanding
review of Q/R assessments} |
Len Vacher introduced Numeracy: the new
journal of the NNN.
In his talk he made three points: 1) Your good work doesn’t exist
as scholarship until it is published. 2) It cannot be considered “good”
until it is peer-reviewed. 3) It will not have impact until it is
indexed (in a bibliographic database). So, support numeracy by
submitting articles to Numeracy.
1up |
|
 2008 StatLit Skills Survey
Milo Schield (Director of the W. M. Keck
Statistical Literacy Project) analyzed the results of a
69 question survey given to 100 students at Augsburg College.
Reliability (Cronbach alpha) was 0.71. Models based on unconditioned and
conditional correlations were compared. The issue of content
validity must be addressed. 6up.
Quirk6up |
Mark Isaacson (Augsburg College) presented
slides on the results of a pilot survey on student's ability to answer
questions about a US Government consumer-directed publication: "Quick
Facts from the 2006 National Survey of Hunting, Fishing and
Wildlife-Associated Recreation." He presented the
associated questions.
and the results in his slide presentation.
6up |
|
MAC3 |
|
Klement Teixeira (pictured), the CUNY Borough of
Manhattan Community Colleges (BMCC), chaired a MAC3 - Q/R
conference.
Speakers included Bill Briggs
(Teaching Q/L), Rebecca Hartzler
(Math Across the Curriculum:
Inspiration and Resources) and Maura Mast (Mathematics and
Democracy). Index.
Program.
Resources. Speakers. |
Bernie Madison (pictured, Univ. of Arkansas,
founder of NNN) presented
Q/L in America: What Kind, How Much
and Beyond. "School and college mathematics is largely dictated by
the needs of developing engineers, scientists, and mathematicians, with
only a bow to general education as an expected consequence." |
|
MAA
MathFest |
|
2008 MathFest Schedule:
David Bressoud (NNN Board member and MAA President-elect, right). Panels on
Quantitative Reasoning included:
*
Role of QL Centers in Supporting Students and Faculty,
* Math Matters: Numerate Approaches to Everyday Issues |
Milo Schield presented "Confounder
Influence on Attributed Cases." (1up)
Deaths attributed to being overweight/obese dropped from 400,000 in 2004 to
28,500 in 2006. "Statistical Literacy must focus on the influence of
confounding on events attributable to an associated factor." "Students
are amazed that 'attributed to' (due to) is totally unrelated to any
causal claim." |
|
Adult Learning Mathematics: ALM |
|
ALM 15 was held in Philadelphia 6/29 - 7/3. Schmitt et
al presented "A
Professional Learning Model for Adult Education Math Teachers."
Katherine Safford-Ramus presented "What
Mathematics should adults learn?" |
The ALM Journal publishes twice a year. The
April 2008 issue focused on "The Future of
Mathematics in Adult Education from Gender Perspectives" The November issue focused on "Parents’ involvement in mathematics
education: looking for connections between family and school."
Vol 1 and
Vol 2. |
|
QUOTES:
Statistical Literacy |
|
STATISTICAL LITERACY
Statistical literacy should be taught in
school beginning in the primary grades.
Collective statistical illiteracy refers to the
widespread inability to understand the meaning of numbers.
Numeracy is a prerequisite to being statistically literate.
Gerd Gigerenzer, Science News
Widespread statistical illiteracy... is cause
for immediate concern because none of us, no matter how thorough our
training, has the time to assess the data independently on every topic. We
all have to rely on the quality of information we get from the media-and, as
of today, that quality is terrible.
Charles Murray
Statistical literacy demands rethinking the
teaching of statistics. ... as a disciplined problem-solving technique.
Statistical literacy is a necessary precondition for an educated
citizenship in a technological democracy.
Gigerenzer et al
Statistical literacy
is an important asset for full citizenship
Peter
Campos, Statistics Portugal
STATISTICS
The quest for statistical significance ... is a
deeply flawed substitute for thoughtful analysis. McCloskey and Ziliak
in "The
Cult of Statistical Significance."
When the difference between two candidates is
not statistically significant, this is not a statistical tie.
Mano Singham,
Nick Beaudrot and
Kevin Drum.
Official statistics are of no use unless they
are used.
Sharleen Forbes
Folk numeracy is our natural tendency to misperceive and
miscalculate probabilities.
Michael
Shermer, Liberal Education
MISCELLANEOUS
The use of graphs and equations is banned from use in
parliamentary debates.
BBC News Magazine
(Reader comment) 8/19/2008
Pre- and in-service teachers do not think of a graph as a tool to
explore data. Gail
Burrill, 2008 IASE
Petabytes allow us to say: "Correlation is
enough." We can stop looking for models.
Data Deluge Makes Scientific Method Obsolete. Wired Magazine.
|
|
International
Statistical Literacy Project |
|
The
International
Statistical Literacy Project (ISLP) issued a web-book: "Government
Statistical Offices and Statistical Literacy."
Editor Juana
Sanchez (Ch
1) noted, "we hope to present some very successful
alternatives: those programs of some National Statistical Offices (NSOs)
whose only purpose is to increase the level of statistical literacy of
the public." |
Ch. 5 by Reija
Helenius. The promotion of skills in statistical
literacy and use of statistics is one of Statistics Finland's strategic
goals. The "How to read and use statistics" module is a good example of
the basics everyone should know. The module was compiled by
Jussi Melkas, (Chair, Advisory Board) who teaches statistical literacy. |
|
Statistics Canada's
Learning Resources website released a
Teacher’s Guide to Data
Discovery developed by Mary Townsend (Ch
4). It helps teachers find interesting and grade-appropriate datasets,
choose appropriate graphs for different kinds of data and calculate
basic statistical measures. See also her 2006 paper, "Developing
Statistical Literacy in Youth." |
Chapter 3 by Sharleen Forbes. "official
statistics are of no use unless they are used. Increasing the skills of
members of the public in how to use statistics as either an information
base or in local community decision making is likely to increase the
overall use and, therefore, the value of official statistics.
[For more details on ISLP, check the
ISLP
Monthly Newsletters.] |
|
New Zealand:
The Certificate of Official Statistics is a vocational certificate involving four units
all in a public-sector context: (1)
Interpret statistical information to form conclusions, (2) Use statistical information
to make policy recommendations. (3) Assess a sample survey and
evaluate inferences; (4) Resolve ethical and legal issues in the collection and use
of data. |
Ch. 7 by Paul Taylor. To increase statistical literacy in schools,
the Australian Bureau of Statistics (ABS)
developed four criteria: data awareness, the ability to understand
statistical concepts, the ability to analyse, interpret and evaluate
statistical information, and the ability to communicate statistical
information and understandings.
Statistical literacy competencies are organized by grade. |
|
ICME-11: Monterrey |
|
July 6-13.
TSG-13 (R & D in the teaching and
learning of statistics). Chairs: Rolf Biehler (Germany) and Mike
Shaughnessy (USA). TSG-14 (R & D in the teaching and learning of
probability). Chairs: Manfred Borovcnik (Austria) and Dave Pratt (UK) |
Maxine Pfannkuch presented "Building Sampling Concepts for
Statistical Inference: A Case Study". This paper examines how
reasoning about sampling variability can be developed in 14 year olds.
Results suggest that teacher-student discourse and imagery were key
factors. One issue is the appropriate use of contextual knowledge in
telling explanatory stories. |
|
Rosemary Callingham
(right, Univ. New England, AU),
Jane Watson &
Julie Donne (Univ. Tasmania) present "Influencing Statistical
Literacy in the Middle Years of Schooling: The first Year of the StatSmart Project." The level of statistical literacy by grade showed
improvements as students aged, but there was little improvement at
"critical engagement" level. |
Ridgway, Nicholson (left) and McCusker presented "Mapping New Statistical
Illiteracies and Literacies." Statistical literacy (SL) has long
been a concern in math education. Current literature provides
evidence that SL is hard to acquire. We present evidence that
understanding MV data need NOT be difficult and we outline some key
targets for future research." |
|
Carmen Díaz (left) and Carmen Batanero presented "Students’ Biases in
Conditional Probability Reasoning." Their data indicated "the
psychological biases investigated are unrelated to conditional
probability problem solving..." The biases studied
included these fallacies: the fallacy of conjunction, the base rate, the transposed
conditional and the time axis. |
"Revealing the Notion of Statistical
Literacy within the PISA Results" was presented by Karen François,
(Free Univ., Brussels), Carlos Monteiro (Fed. Univ. Pernambuco, Brazil)
and Stijn Vanhoof (Catholic Univ, Leuven). They concluded that
"mathematical and statistical literacy are highly related" (for both
students and countries). |
|
"A Parallel Discussion of Classical and
Bayesian Ways as Introduction to Statistical Inference – Teacher
Training in Hungary" was presented by Ödön Vancsó. "a lot of them
[student-teachers] confirmed that they understood the very notion of
probability better and could apply the theory of probability more
self-confidently in real situations. |
by Tim Erickson. "We compare and
contrast statistical inference with scientific inference, looking for
perspectives and insights to help us improve instruction in this
difficult topic. The problem of getting the underlying logic
right—and all of its ramifications, linguistic and otherwise—seems to be
a persistent problem that science and statistics share." |
|
IASE 2008 Monterrey |
|
Carmen Batanero chaired "Statistics Education
in School Mathematics: Challenges for Teaching and Teacher Education"
held June 30-July 4. A
discussion document presented the background, the current issues and
the organization of the invited papers in six categories. All
papers are currently accessible under Proceedings/Sessions and Papers. |
Jim Ridgway (pictured), James Nicholson and Sean
McCusker (U. Durham) presented Reconceptualizing 'Statistics' and
'Education'. On statistics, "most interesting problems are
multivariate (MV)." On education, "the curriculum (and ideas about
statistical literacy) should encompass reasoning with multivariate [MV]
data" [A fascinating read! Ed.} |
|
In "Strengthening the Interplay between
Probability and Statistics..." Delia North (South Africa, pictured) and
Helen MacGillivray (Australia) argue that "too long a focus on ...
equally-likely scenarios .. stultifies growth .. and turns Chance into a
backwater of boredom." They support "the use of relative
frequencies to estimate conditional probabilities..." |
In "A Plea for a Relative Strong Role For
Probability...", Manfred Borovcnik (Austria) noted that while
"probability is rapidly vanishing out of the curricula," "only a sound
notion of conditional probability enables learners to grasp any kind of
inferential statistics" and elaborations on probability are
necessary to reveal the peculiarity of stochastic thinking. |
|
Gail Burrill (Michigan State)
presented "Fundamental Ideas in Teaching Statistics and How They
Affect the Teaching of Teachers". The importance of graphs was
noted along with the preference for bar graphs and the reluctance to use
scatterplots. Yet scatterplots are needed to show relationships
between variables such as equality. |
In "A Focus on Graphing", Janet Ainley
(Leicester, pictured) and Carlos Monteiro (Brazil) noted that "materials
designed to support teachers' implementation of the curriculum reflect
a more passive approach to graphing" -- construction. They argue for
"the importance of active use of graphing [interpretation] for the
emergence of transparency." |
|
Joachim Engel (pictured), Peter Sedlmeier, and Claudia
Wörn presented "Modeling Scatterplot Data and the Signal-Noise Ratio:
Moving toward Statistical Literacy for Pre-service teachers."
Results: the real-data modeling approach in an applied mathematics
course improves statistical thinking skills without explicitly focusing
on statistics." |
In "Statistics: A Look Across K-8 Standards,"
Jill Newton (pictured), Leslie Dieteker and Aladar Horvath (Univ.
Michigan) found that state requirements involving the four statistical
processes (Question, Collect , Analyze and Interpret) fall into two
groups: the knowledge to 'do' each of the four processes vs. the
knowledge to 'understand' or 'evaluate' each of the four. |
|
Pablo Carranza and Alain Kuzniak (University of Paris Diderot, France)
reviewed French school textbooks and found that "the Frequentist
definition is the only approach taught while students are confronted
with Frequentist and Bayesian problem situations." {Bayesian
probabilities about fixed parameters may be confused with inverse
probabilities using Bayes rule. Ed.} |
In "Modeling and Simulation in Statistical
Education', Brigitte Chaput, Jean Claude Girard and Michael Henry note
that "the definition of probability as a stabilized relative frequency
raises serious epistemological problems. because it characterizes a
mathematical object (probability) from experimental data (frequency)."
|
|
New Zealand Statistics
Conference |
|
Sharleen Forbes gave a keynote address,
Surfing the Education Wave
Using Official Statistics. Explains the importance of
properly articulating the "story" behind the number and showing how
graphs and percentages can add to an article. |
by
Maxine Pfannkuch. Research has concluded that students’
conceptual growth hindered by limited understanding and lack of a sense
of variability and distribution -- a lack of attention to conceptual
development in earlier years. On informal inference, see the proposed
rules in "Making the
Call" on slides 13 & 17. |
|
ASA:
Statistical Literacy |
 Statistical
Literacy: 2008 Statistical
Literacy: 2008
Larry Lesser (University of Texas, El Paso) chaired the 2008 session on Statistical
Literacy at the national meeting of the American
Statistical Association held in Denver Colorado. This is the 11th session on
statistical literacy organized by Milo Schield. Approximately
60-80 attended. |
Gary Klass presented "a short
summary of the most common statistical fallacies found in public debates
employing social indicator data as the evidentiary premises of arguments
about politics and public affairs. The purpose is to offer students a
convenient framework for evaluating, and developing their own, arguments
relying on social indicator data." Slides |
|
Jane Miller
(Rutgers Univ.) presented Substantive Significance of Multivariate
Regression Coefficients. Few, if any statistics textbooks show
how to assess and present substantive significance -- in the context of
the specific research question. See
also
The
Goldilocks Principle: Avoiding Pitfalls in Interpretation of Regression
Coefficients. Slides 1up |
Robert Raymond (right, University of St. Thomas) presented Numbers in the News: A Survey -- co-authored with Milo Schield
(below). Their paper analyzed 800 news articles involving numbers and tabulated the
prevalence of 360 different types of statistics and their use as evidence
for causation. Slides:
6up
1up |
|
"Using Simulated Surveys to Teach Statistics: A Preliminary Report"
by Marc
Isaacson. This program allows students to spend their time
designing survey questions and analyzing realistic data on any topic. Given student input, the
simulation program generates a random sample of realistic survey data
which allow students to do traditional data analysis..."
slides |
Milo Schield (left) and Tom Burnham (Cognitive Consulting) presented
"Von Mises' Frequentist Approach To Probability." Conclusions: It
is unwarranted to say that the 13 letter combination of ‘Massachusetts’
is as likely as any other.
We should disallow any statement of
probability that applies to a single individual without
reference to their group."
slides |
|
Cynthia
Schield (left) presented "Student Attitudes toward Statistics at
Augsburg College"; Milo Schield co-author. "This data showed a
statistically significant increase in students’ feeling of cognitive
competence and a statistically significant increase in the difficulty of
the course." Students' value increased but was not statistically
significant. |
Milo Schield (left) organized a round table on "Teaching Confounding
And Multivariate Thinking In Introductory Statistics." Most
attendees were from bio-statistics. They agreed that
confounding was absolutely essential but were unsure as to how to teach
it in an introductory course. |
|
ASA 2007 |
|
David Kriska (Walden U.),
Mark Fulcomer
(Stockton College of NJ) and Marcia Sass (UMD-NJ) presented
Expectations for Statistical Literacy: A
Survey Of College Faculty."
Top faculty goals: 1) Create useful graphs, 2) Make real-world decisions
consistent with data, 3) Apply statistical formula using a
hand-calculator and 4) Make a persuasive argument based on statistical
analysis. See their 2006 paper:
Expectations for Statistical Literacy: Comparison among Professions."
|
Linda Cooper and
Felice Shore (Math Dept, Towson University) presented "Students’
Reasoning about Summary Measures from Histograms and Stem-and-Leaf Plots"
Only 32% of their students correctly concluded that mean income was
right of median in a right-skewed distribution. Less than
half their students could accurately calculate a mean or median given a
histogram. |
|
European Conference on Methodology |
|
The
third
European Conference on Methodology was in Oviedo July 9-11.
Keynotes included "How to Construct Latent Variables" by Rolf Steyer
(left) and "Validly estimating dose-response when ... dose is
self-selected" by Don Rubin (right). |
Kai Ruggeri (Queens Univ., Belfast) presented
"International Focus on Statistics Education" with Carmen Diaz (Spain).
This paper compared psychology majors in four countries: Ireland, Spain,
Austria and the US. It analyzed correlations between STARS, SATS
and related factors. Variation in confidence explained over half the
variation in attitudes. Slides
6up |
|
Two papers focused on observational
studies. Tamás Rudas presented
Intent-to-Treat Analysis in
Observational studies. He compared the Odds Ratio,
Relative Risk and a new Cross-Sum-Ratio on consistency, indifference,
and invariance against changes in allocation. Schield and Burnham
presented slides on Binary Confounders as
Mathematical Objects. |
José Carmona Márquez presented "Testing for
measurement invariance of the Survey of Attitudes Toward Statistics: A
comparison of Italian and Spanish students." Strong
invariance was OK across time, but not across country. Weak invariance
was OK for both. Co-authors were Caterina Primi and
Francesca Chiesi from University of Florence. |
|
Unreported Previously |
|
College
Student Literacy Levels
By AIR (2006).
Report Among U.S. four-year college students, the percentage
who are at the BASIC levels is 6% for document literacy, 7% for prose
literacy and 20% for quantitative literacy. The percentage of
four-year college students who are PROFICIENT is 40% for whites, 20% for
Asians, 19% for Hispanics and 5% for blacks. Being proficient in
quantitative literacy means they can compare credit card offers with
different interest rates or the cost per ounce of different foods. |
In her 2004
senior thesis at Wittenberg, Brianne Barclay found that less than
50% of Econ/Mgmt/Math majors and less than 20% of Psychology/Sociology
majors agreed (versus neutral or disagreed) that they would take
statistics voluntarily. While 94% of all those surveyed said they
understood "what it means for data to be statistically significant,"
only 78% said they understood "how the null hypothesis is important to
the analysis of research."
Published by VDM Verlag. |
|
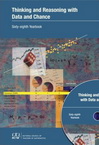
Edited by Gail Burrill and P. Elliott (2006).
Thinking and Reasoning with Data and Chance
Sixty-eighth Yearbook.
Reston, VA: National Council of Teachers of Mathematics. |
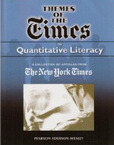 Themes
of The Times on Q/L Themes
of The Times on Q/L
Bennett and Briggs (128 pgs, 2007). Themes of Times on Quantitative Literacy for Using and Understanding Mathematics for Using and Understanding Mathematics: A Quantitative Reasoning Approach. This collection "from The Times explores a wide range of quantitative
topics appearing in recent news...stories." Articles linked to textbook. |
|
New Editions |
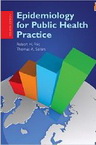 Epidemiology
for Public Health Epidemiology
for Public Health
By Robert Friis and Thomas Sellers.
Epidemiology for Public Health Practice ($72, 3rd ed. 2008). "Epidemiologic
speculations and research findings increasingly blaze across media
headlines and heighten anxiety among the public. Understanding the
foundations of such news can be daunting. The Third Edition has been
extensively revised ..." |
 Concepts
of Epidemiology Concepts
of Epidemiology
By Bhopal (2nd Ed, 2008). Concepts of Epidemiology:
Integrating the ideas, theories, principles and methods of epidemiology.
"illustrates epidemiology and its applications to policy
making, health service planning, and health promotion."
"emphasizes theories and principles ... countering the mounting criticism that epidemiology is an
a-theoretical discipline" |
|
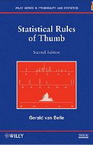
By Gerald van Belle (2nd ed., 2008, 272pg,
$57). Statistical Rules of Thumb.
Topics include covariation, design, consultation, epidemiology,
and data representation. Each of the 99 rules has a brief introduction,
a simple statement of the rule, illustrations, theoretical
underpinnings, and extensions. 2nd edition has new chapters on
observational studies and evidence-based medicine. |
 Turn
Numbers into Knowledge Turn
Numbers into Knowledge
By Jonathan Koomey (2nd ed. 2008,
247pg, $17). "A lively, well-written, attractively packaged book on the
art of critical thinking." —Skeptical Inquirer. |
|
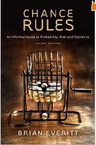
by Brian Everitt (2nd ed., 2008).
Chance Rules: An Informal Guide to Probability, Risk and Statistics
"Additional material in the second edition includes, a probabilistic
explanation of why things were better when you were younger,
consideration of whether you can use probability to prove the existence
of God... learn about probability without complex mathematics." |
 Workshop
Statistics Workshop
Statistics
By Allan Rossman and Beth Chance (2008, 616
pgs, pb textbook, 2nd ed. $69). Workshop Statistics: Discovery
with Data and Minitab. Other varieties: with JMP, SPSS, Excel ,
graphing calculators and Fathom. |
|
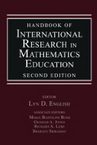
By English (2008, 925 pgs, 2nd ed, $100). Handbook of International Research in Mathematics Education
presents "important new mathematics education research that makes a
difference in both theory and practice" including "democratic access to
powerful mathematical ideas, advances in research methodologies and
influences of advanced technologies. |
 Statistical
Reasoning in Educ. Statistical
Reasoning in Educ.
By Theodore Coladarci, Casey Cobb, Edward
Minium and Robert Clarke. Fundamentals of Statistical Reasoning
in Education (2008, 2nd ed., 496 pg.) is an introductory statistics
textbook written specifically for the discipline of education. See
also, Statistical Reasoning in Psychology and Education
(Paperback) by Edward Minium and Bruce King. |
 Stats
for the Social Sciences Stats
for the Social Sciences
By Alan Agresti and Barbara Finlay (2008, 624
pgs., 4th ed. textbook) Statistical Methods for the
Social Sciences. |
 Mathematical Thinking & QR Mathematical Thinking & QR
By Linda Sons, Peter Nicholls and Joseph
Stephen (4 Lslf edition, 364 pgs., 2008, $67
Kendall Hunt). The associated course "develops competency in
problem solving and analysis, which is helpful in personal
decision-making; in evaluating concerns in the community, state and
nation; in setting and achieving goals; and in continued learning." |
|
Web News |
14,000 views: Percentage Graphs
Paper
Over 1,000 views in just one day
May 16, 2007: Blogger John Walker said Schield's 2006 ASA paper,
Percentage
Graphs in USA Today, was "technical" but "pretty interesting." The
paper took off with
over 8,000 viewings in 2007. Less were expected in 2008. But in 2008 there have been over 14,000 viewings for a lifetime total of
over 22,000. In one day (August 25th 2008), there were 1,080 viewings. |
YouTube Videos (11/08)
Confidence (20,020): level (906), interval (64).
Statistics: (9,500): song (5,800), rap (803), math (560), lecture (106).
Significance (5,340): practical (293), level (243), statistical (97),
testing (94).
Hypothesis (1,710): test (183), testing (81), null (38)
Correlation (1,200): analysis (41), causation (20), coefficient (18),
Spurious (252), Causation (249), Margin error (195), Statistical
significance (12)
Mean, median (115): See
Mean, Median and
Mode: Cute! 86,157 views |
|
 Stats
in Business Schools Stats
in Business Schools
Bill Parr (past-President of
Making Statistics Effective in Schools of Business and now Professor of
Decision Sciences, CEIBS) has started a new Google group:
Teaching
Statistics in Business Schools. "The purpose of this group is to
entertain discussion on the subject of teaching statistics in business
schools."
|
 SATS
On-Line SATS
On-Line
Marjorie
Bond (Monmouth
University) is hosting the Survey of Attitudes Toward Statistics on
the web using SurveyMonkey. This makes handles the linking of pre
and post test results by student. This may require IRB approval
but it decreases the chance of instructor access to student identities.
For more on SATS, see Schau and
Schield. |
|
Statistics/STEM Grants and Projects |
|
In 2008, the
NSF
awarded Ohio State $66,035 in a CCLI-Phase 1 grant.
Dennis Pearl
(right) and Kathleen Harper are co-PIs.
This is one component of a collaborative effort to develop and
pilot the National Statistics Teaching Practice Survey (NSTPS). This
component is creating a database, a reporting structure and a mechanism for administering the survey online. |
In 2008 the
NSF
awarded the U. of Minn. a $71,877 CCLI-Phase 1
grant to fund Advancing of
Assessment of Scientific and Quantitative Reasoning.
Joan Garfield (left) is PI with Robert delMas. This project is ... a
collaborative effort to develop and pilot the NSTPS.... This project
is ...refining the instrument and working with researchers
from other STEM disciplines. |
|
INQUERI: Infrastructure - STEM Research
INQUERI is the INstitute
for QUantitative Education Research Infrastructure. "Our mission is to
advance the application of scientific research methods to STEM education
by establishing an INstitute for QUantitative Education Research
Infrastructure in teaching mathematical, biological, engineering, and
physical sciences at the college level. Dennis Pearl (OSU) is the
INQUERI director. |
ASSESSING SCIENCE ED: WISER
II at OSU
NSF sponsored WISER-II,
Workshop on Infrastructure in STEM Education Research, at Ohio State
University (OSU) Feb. 21-22, 2008. The focus is on the integrated
development, deployment, and research use of the resulting data for
instruments to support assessment efforts. Dennis Pearl (OSU) is project
director. The goal is the Database of Assessment for Nationwide Science
Education Research (DANSER) |
|
In 2008, the
NSF
awarded UCLA $142,615 to fund a CCLI-
Phase 1 grant
titled "Teaching and Learning Infrastructure for Introductory Statistics
Redesign."
Robert Gould (right) is the PI along with Mahtash
Esfandiari. The goal is
to encourage students to perform high-level thinking in intro
statistics. |
"The Introductory Statistics Redesign
Infrastructure (ISRI) project is constructing a model for effectively
integrating the ASA supported best teaching practices into large,
previously lecture-based introductory statistics courses. The project
team is developing materials to assist instructors with incorporating
active learning techniques in their classes and is developing teaching
assistant materials to improve small-group instruction. Together
these...supplements
provide a model for teaching an activities-based, learner-centric
introductory statistics course." |
|
OTHER ARTICLES |
Clinical
Implications of Numeracy: Theory and Practice by
Nelson,
Fagerlin, Lipkus and Peters in Annals of
Behavioral Medicine V. 35, Issue 3 June 2008. "Low
numeracy cannot be reliably inferred on the basis of patients'
education, intelligence or other observable characteristics. "Numeracy
... is the ability to comprehend, use and attach meaning to numbers." See Assessing Numeracy.
Does British Sociology Count?
Sociology Students' Attitudes toward Quantitative Methods by Malcolm
Williams. Sociology Oct2008, Vol. 42 Issue 5, p1003-1021
Numeracy and Communication with
Patients: They Are Counting on Us by Andrea Apter. Journal of
General Internal Medicine Dec2008, Vol. 23 Issue 12, p2117-2124
Perspective: The Role of Numeracy
in Health Care by Russell Rothman, Victor Montori, Andrea
Cherrington and Michael Pignone. Journal of Health Communication
Sep2008, Vol. 13 Issue 6, p583-595.
Can we count on written symptom
scores: Impact of numeracy on patient access to appropriate healthcare
by Timothy Johnson in Journal of the American College of Surgeons
Sep2008 Supplement, Vol. 207 Issue 3, pS112-S112. |
Journal Articles: Statistical Literacy
The Evolution of Pearson's
Correlation Coefficient by Gary Kader and Christine Franklin in
Mathematics Teacher Nov. 2008, Vol. 102 Issue 4, p292-299. "Provides a
framework for achieving statistical literacy in schools."
Learning to Read the Numbers: A
Critical Orientation toward Statistics by Phyllis Whitin and David
Whitin in Language Arts Jul. 2008, Vol. 85 Issue 6, p432-441.
The impact of the format of
graphical presentation on health-related knowledge and treatment choices
by Sarah Hawley in Patient Education & Counseling Dec. 2008, Vol. 73
Issue 3, p448-455.
A Random Walk through Middle Land
by Michael Shermer in Scientific American Oct2008, Vol. 299 Issue 4,
p40-40.
Statistical Literacy: A
Prerequisite for Evidence-Based Medicine by John Monahan,
Psychological Science in the Public Interest Nov2007, Vol. 8 Issue 2,
pi-ii.
Statistical Literacy for Readers
of Pediatrics: A Moving Target by Hellems, Gurka and Hayden in
Pediatrics Jun2007, Vol. 119 Issue 6, p1083-1088
|
Quantitative Literacy for
Undergraduate Business Students in the 21st Century by Richard
McClure in the Journal of Education for Business Jul/Aug2008, Vol. 83
Issue 6, p369-374. "educators are not adequately preparing business
school students in quantitative methods"
|
Journal Articles: "Quantitative Reasoning"
MEDIA clips in Mathematics Teacher Nov/, 2008, Vol. 102 Issue 4,
p272-275. "A quiz related to authentic applications of
quantitative reasoning based on print or electronic media. " |
|
TOP SITE-PAPERS VIEWED |
Papers with over 100 views at
www.StatLit.org in 2008.
Excludes papers hosted during 2008.
Total downloads: 106,035.
-
-
-
-
-
-
-
-
-
-
-
-
Statistical
Prevarication: Telling Half Truths Using Statistics. Schield,
2005 IASE (898)
-
Why Should We Even Teach Statistics? A Bayesian
Perspective.
Gudmund Iversen, 2000 Tokyo Round Table (790)
-
-
Three Paradoxes.
Howard Wainer, Nat. Board of Medical Examiners. Draft for The American Statistician 2004 (750)
-
-
-
-
-
|
-
-
-
-
-
-
-
-
-
-
-
-
-
As of 12/2008, 468 pdfs hosted. Of these, 248 are slide handouts: *up.pdf.
This 2008 ranking excludes
these summary/auxiliary PDFs:
-
Q/R Textbooks PDF of
StatLit Q/R textbook web-page (1,047)
-
-
S/R Textbooks PDF of the
Statistical Reasoning textbook web-page (163)
This 2008 ranking excludes
papers hosted during 2008.
-
-
-
-
-
|
|
TOP
20 SITE-PAGES |
Top 20 StatLit Web Pages Viewed at
www.StatLit.org in 2008.
(###
of page views)
Voluntary page views: 63,926 -
a 31% increase from 2007
-
Welcome (10,423, 25%): Home/Index
page. Site overview.
-
Joel Best
(3,118, 7%): Author of "More Damned Lies & Statistics"
-
StatLit Papers
(2,444, 6%): Papers, articles or slide presentations.
-
Q/L Textbooks
(2,387, 6%): Details on Q/R or Q/L textbooks.
-
Gerald
Bracey (2,035, 5%): Author of "Reading Educational Research"
-
Adult Numeracy (1,987, 4%): News on
adult numeracy projects.
-
Howard Wainer (1,966,
5%):
Author of "A Tout in the Milk".
-
StatLit News 2007 (1,928,
5%):
Stat-Lit News from 2007.
-
Standardizing (1,718, 4%): Excel graph
illustrates standardizing.
-
StatLit Books
(1,680, 4%): List of over 300 Stat-Lit related books.
-
John Paulos (1,669,
4%):
Author of "Numeracy".
-
StatLit News 2006 (1,523,
4%):
Stat-Lit News from 2006.
-
Gerd
Gigerenzer (1,503, 3%):
Author of "Calculated Risks"
|
-
Q/L Books
(1,459, 3%): Details on Q/L-related books (not texts).
-
Q/L Activities
(1,378, 3%): Details on Q/L-related activities.
-
Dennis Haack (1,276,
3%):
Author of "Statistical Literacy" 1979.
-
StatLit
News 2004
(1,183, 3%): Stat-Lit News from 2004.
-
StatLit News 2003
(715, 2%): Stat-Lit News from 2003.
-
StatLit
News 2005
(686, 2%):
Stat-Lit News from 2005.
-
Numeracy books (502, 2%)
Navigation page views totaled 8,474: Statistical
Literacy (2,100), StatLit News
(1,863), Authors (1,860), Statistical
Reasoning (1,425) and
Numeracy (1,226).
Other pages include
Statistical
Reasoning Textbooks (462, 2%) and Statistical Reasoning books (142).
Student-assigned (involuntary) pages views
(/GC) totaled 5,548. These included the
grammar-checker programs (SLRSV.aspx) with 3,374 views and the
Part-Whole program (PartWholeImages.aspx)
with 2,169 views.
|
|
TOP
20 SITE SEARCH-TERMS |
Top 20 terms in search referrals to
www.StatLit.org.
Search referrals (2008; 2007).
References
shown are likely targets.
-
Joel Best (1,147; 594):
See Joel Best author page. [Could be Billie
Joel]
-
USA Today graphs (654; 634): Schield
Percentage Graphs in USA Today
-
Quantity words
(547; 264): See Schield, Why
Students Use 'Many'?
-
Statistical Literacy
(385; 249): See Statistical Literacy.
-
Howard Wainer (340; 110): See
Howard Wainer
author page.
-
Gerald Bracey (214; 94): See
Gerald Bracey author page.
-
Standardiz... (100; 131):
Schield, Adjusting for
Confounding Graphically.
-
Lord Paradox
(67; 126): See Wainer's article,
Three Paradoxes.
-
Math across curriculum
(60): See Numeracy
-
Simpson Paradox
(59; 54): Schield, "Adjust for
Confounding Graphically".
-
Standardizing (59):
Schield, Adjusting for
Confounding Graphically.
-
StatLit (57, 24): See this site.
|
-
Histograms interpreting (50):
-
Percentage graphs (48; 44):
See Schield, Percentage Graphs in
USA Today.
-
Statistics research
(46; 95): See StatLit Tools page.
-
numeracy
(39): See Numeracy
-
quantitative reasoning (33):
See Numeracy or Q/L
-
PIACC
(30)
-
Percentage Tables (26): See Schield,
Reading Tables of Rates & Percents.
-
rethinking mathematics teaching (20)
Each month, LiveStats ranks the search
terms used and captures the top 20 with the associated number of
referrals. In 2008, this generated 85 unique search terms with 4,176
visits (plus 13,918 Other) for a total of 18,094 total search
referrals. These 85 search terms were grouped by search phrase
(so 'standardizing' and 'standardized' were counted together) into
40 groups. Note that these numbers are very sensitive to
how search terms are grouped into search phrases. Note that 77% of the search
referrals are tabulated under Other.
|
|
GOOGLE SITE RANKINGS |
|
Google ranking (12/2008) of
the
www.StatLit.org web site.
When multiple words are shown, they
are searched as a phrase.
#1: Statistical literacy, Joel
Best, Howard Wainer, Bernie Madison, quantity words, data literacy, chance grammar
#2: USA Today graphs,
Dennis Hack, interpreting doublespeak, statistical doublespeak,
statistical standardization,
statistical prevarication
#3: Gerald Bracey,
standardizing, percentage graphs, multivariate thinking
#5: John Paulos
Top 10:
journalistic significance (6),
percentage grammar (7)
|
Top 30: innumeracy (12), statistically literate (14), statistical reasoning (17), confounding (19), statistical
illiteracy (20), Gigerenzer (21), statistical paradoxes (22),
statistically illiterate (23), quantitative Literacy (24), confounding (28).
Top 100: quantitative literacy (31), numeracy (38), quantitative
reasoning (43); critical thinking, induction statistics (44); confounder
(57; 131), social construction (64), statistical education (75),
Simpson's paradox (82; 288), Lynn [Arthur] Steen
(95).
This site ranks
#4 for Milo Schield but was not in the first 1,000 for spurious,
standardization, confounded, confound,
"health literacy" or "health numeracy."
|


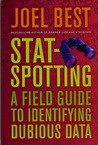
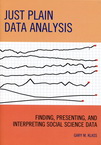
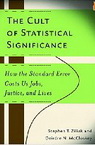
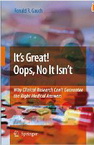
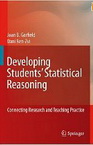
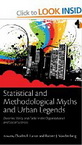

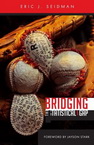
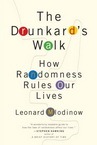
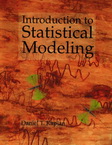

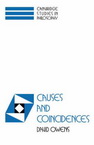
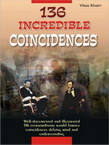
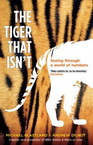
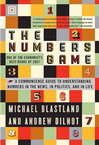
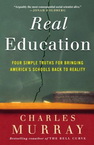


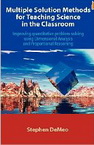
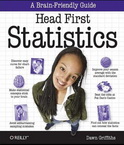


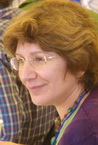
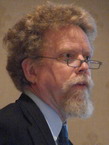


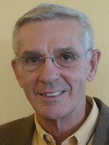


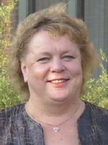
 Official
Stats: Canada
Official
Stats: Canada