Highlights 2010***
-
StatLit.org Grows: Downloads up
15%, visits up 35% and domain referrals up 50%. More than 20,000 home page
views, 60,000 domain referrals, 100,000 page views, 175,000 visits
and 200,000 downloads. Google-ranked
#1 for "statistical literacy": 6th year.
-
19% of US four-year colleges
offer
Statistical Literacy course. NCTM President advocates
statistical
literacy.
-
RSS launches 10-year educational initiative in Statistical Literacy. ASA
supports a political campaign to promote Statistical Literacy.
-
Top professional book***:
Assessment Methods in Statistical Education,
Wiley. Chapters by Davies and Marriott, MacGillivray, Jolliffe,
Garfield et al, Budgett and Pfannkuch, and
Schield.
Google books
|
***
Selected by the StatLit webmaster |
|
|
|
|
|
|
TOP NEWS |
|
Wired Magazine picked
Statistical Literacy (Making
sense of today's data driven world) as their #1 choice among
neo-liberal college courses. "Our world is shaped by widespread
statistical illiteracy." "Why take this course? We are
misled by numbers and and by our misunderstanding of probability.
What you'll learn: How to to parse polls, play the odds and
embrace uncertainty." |
November (2010) Issue:
By David H. Freedman on John Ioannidis: "His model predicted rates
of wrongness ... corresponding to ... rates at which findings were later
convincingly refuted: 80% of non-randomized studies ... turn out to be
wrong, as do 25% of supposedly gold-standard randomized trials, and as
much as 10% of the platinum-standard large randomized trials." |
|
J.
Michael Shaughnessy, NCTM President.
"Statistical literacy has risen to the top of my advocacy list,
right alongside numeracy, and perhaps even ahead of “algebra for all.”
By statistical literacy, I mean ... developing the ability to reason in
the presence of, or under conditions of uncertainty. ... the facility to
read and interpret statistical information and make informed
inferences...." |
Katherine Wallman, US Chief Statistician.
"people have ... a lot of computer literacy, but they don’t necessarily
have statistical literacy to go with it. I do have a concern
... about the gap between the availability of information and the
computer literacy of our population and the statistical literacy they
should have if they’re going to use these numbers most intelligently." |
ASSESSMENT METHODS IN STATISTICAL
EDUCATION |
 Assessment
in Stats Education Assessment
in Stats Education
Assessment Methods in Statistical Education: An International
Perspective (Wiley, 2010). Edited by Bidgood, Hunt and Jolliffe.
Ch 1: Assessment and feedback in statistics by Neville Davies and
John Marriott. Ch 2: Variety in assessment for learning statistics
by Helen MacGillivray. Part C: Assessment Using Real-World Problems;
Part D: Individualised Assessment.
Cover and TOC |
 Assessing
Statistical Literacy Assessing
Statistical Literacy
Introduction by Flavia Jolliffe
(left). Ch 7: Assessing important learning outcomes in introductory
tertiary statistics courses by Garfield, delMas and Zieffler. Ch 8:
Writing about findings: Integrating teaching and assessment by
Forster and Wild. Ch 10: An assessment strategy to promote
judgement and understanding of statistics in medical applications by
McNiece |
  Students'
Stat Literacy Students'
Stat Literacy
Assessing students’
statistical literacy by
Stephanie Budgett and
Maxine Pfannkuch.
"The course is designed to prepare everyone ... to become critical
consumers of statistical information." "we ask students to
evaluate media articles, journal articles and technical reports ..." |
 Assessing
StatLit: Take CARE Assessing
StatLit: Take CARE
Milo Schield. "Statistical competence is the ability to produce, analyse and summarise detailed statistics in surveys and studies.
Statistical competence is needed by ‘data producers’.... Statistical
literacy is the ability to read and interpret summary statistics in the
everyday media: in graphs, tables, statements and essays. Statistical
literacy is needed by data consumers."
Excerpt |
ASA Statistical Literacy Campaign |
|
"The ASA requests your participation in our
statistical literacy grassroots campaign by asking your U.S.
Representative to cosponsor H.R. 6355, Statistical Teaching, Aptitude,
and Training Act of 2010 (STAT Act of 2010)." Statistical Literacy
one-pager (2009):
Statistical Literacy in PreK-12 Education. For details, see
the
column written by ASA Science Director, Steve Pierson (left). |
SUMMARY: "To amend the Elementary and Secondary Education
Act of 1965 to provide for the development of State statistical
literacy plans and to authorize the Secretary of Education to make
grants for statistics-related teacher professional development and the
improvement of statistics education." This initiative was
originally suggested to Congressman Loebsack by ASA member Ann Canon,
Cornell College.
Bill summary
Bill tracker |
|
(1) Statistical literacy, the understanding and use of
the language and tools of statistics, is vital for United States
citizens in an era of intense global competition and growing reliance on
data, because of a statistically literate individual's ability to-
(A) ask and evaluate critical questions about the design of a study and
the appropriateness of the conclusions drawn from a study;
(B) distinguish arguments based on data and evidence from arguments
based on anecdotes;
(C) recognize and interpret different representations of data in
context,
(D) formulate questions that can be addressed with data, collect and
organize relevant data, and draw appropriate statistical conclusions. |
(2) Statistical literacy is essential for both
effective citizenship and personal well-being because of the everyday
need to -
(A) interpret and synthesize data displays and
summaries, such as polls, surveys, and study outcomes; and
(B) critically evaluate claims based on data -
(i) as a
consumer of the news media;
(ii) in
making medical decisions; and
(iii) in
making financial decisions, such as decisions related to a mortgage
or a car repair.
|
|
The American Statistical Association (ASA) recognizes that "statistical
literacy is a vital component of mathematics education. Statistical
literacy— the understanding and using the basic language and tools of
statistics, recognizing and being able to interpret different
representations of data in a context, and knowing how to ask critical
questions about the design and conclusions of a study — is a vital
component of mathematics education. It includes the understanding and
interpretation of data and graphs, including the ability to make
rational decisions in the face of uncertainty. [italics added]
Quantitative literacy
includes statistical literacy, but also addresses understanding
mathematical relations (e.g., investment income growth) and number sense
(e.g., What is the per capita share of a $700 billion bailout debt
spread among 300 million citizens?" [Statistical literacy is
"a subset of Quantitative Literacy."] |
Not teaching statistics [in K-12]. Teaching
formula/definition, not statistics – E.g., Mean, mode, median
[Teaching] Probability, not Statistics. [What is] Missing:
Context, Interpretation, [and] Statistical problem solving skills
(scientific methods, critical thinking).
Statistical Literacy: Every-day skills – Media, medical,
business, finance • Understanding Data • Decision-making, Risk • Facing
Uncertainty • Enhancing Math and Science Education.
"Most of the staffers perceived statistics to just be the making of dry
tables of summary numbers. They were all receptive to our clarifying
that the field was really focused on critical thinking and methodology
for the whole investigate process, from question formulation through
data collection, analysis, and interpretation. The staffers all became
very interested and shared our concerns over critical thinking skills.
They did not realize that was what the profession was all about." |
RSS Statistical Literacy Campaign |
|
The Royal Statistical Society (RSS) launches
a 10 year statistical literacy campaign. To mark the event, the
RSS Centre for Statistical Education (RSSCSE) and
the University of Plymouth hosted a series of free statistical education
days and workshops 20 - 26 October.
UN Announcement of
RSS statistical literacy campaign |
"Working for a society in which our lives and choices are enriched by an
understanding of statistics." "Numbers are everywhere. But mostly
we don't really get what they mean, even when they're key to the
important choices we make in our lives. The getstats campaign is about
turning this around – giving everyone the skills and confidence to use
numbers well. Otherwise as individuals and as a society we'll just keep
missing out.
Posters:
media, politics, school, work |
|
"We are amplifying and
adding to debate about pathways to statistical literacy for 16-18 year
olds, for those taking job training and apprenticeships and those
entering higher education. We are working with examination boards,
sector skills councils, teachers and learned societies in examining the
content of subjects in which numeracy is becoming increasingly
important." |
"We are
joining the work of the Economic and Social Research Council, the
Department for Business, Innovation and Skills and the British Academy
in increasing the quantitative and methods elements in social science
and certain humanities first degrees and, in collaboration with the
universities and higher education authorities, examining the possibility
of a benchmark in statistical literacy for all first degree students."
|
|
Statistics underpin many different news stories appearing on TV or
radio, in newspapers or on the web. Working with journalists to report
statistics well ... |
 ASA
Applauds getstats ASA
Applauds getstats
"The ASA applauds and congratulates the RSS on the timely launch of
getstats on World Statistics Day. The vision of this campaign
is a society we not only want to live in, but one we desperately
need - a statistically literate citizenry capable of
understanding data and making informed choices based on that
understanding.
Ron Wasserstein, ASA Director |
|
The Royal Statistical Society
Centre for Statistical Education (RSSCSE) generated a
diagram of the big ideas in statistics. Here is the foundation
level. |
Towards More
Accessible Conceptions of Statistical Inference
by Chris Wild, Maxine Pfannkuch, Matt Regan and Nicholas Horton. We
"present some specific and highly
visual proposals. These build on novel ways of experiencing
sampling variation and have intuitive connections to the standard
formal methods of making inferences in first university courses."
[Schield
comment] |
|
"The Ipsos Mori survey
commissioned by the Society for the launch of the getstats 10-year
statistical literacy campaign also revealed that nearly half of the
people don’t understand the statistics or figures behind the
government’s spending cuts." "However, in an easy question about
understanding chance, where people were asked what is the probability of
getting two heads if you spin a coin twice, only thirty per cent got the
right answer"
Press Release |
Royal Statistical Society President,
Professor David Hand, says: “The Royal Statistical Society’s getstats
campaign is about giving everyone the skills and confidence needed to
understand data and statistics. “Numbers are everywhere in our lives,
and statistics is about turning these numbers into useful information on
which we can take action. People need to appreciate the power of
statistics as it can be the key to the important choices we make in our
lives. “Our getstats campaign is intended for everyone, and especially
those with responsibility to educate and inform the public about
statistics – teachers, employers, the media and elected
representatives.” |
|
"The Royal Statistical Society
getstats Campaign:Ten Years to Statistical Literacy?" by Neville Davies,
Director of the RSS Centre for Statistical Education. "Numbers are
everywhere. But mostly we don't really get what they mean, even when
they're key to the most important decisions in our life." |
"The
GetStats campaign is about turning this around. Giving everyone the
skills and confidence to use numbers well. Otherwise as individuals and
as a society, we'll just keep missing out."
Working to influence
those who inform us most about statistics: the media, elected
representatives, employers, and schools and universities." |
|
Identify or critically evaluate: "1.
Media accounts of an issue 2. Advertising 3. Use in other
subjects 4. Graphical representations 5. Risk assessment 6. Misuses of
statistics 7. Nature of sampling 8. Anecdote and design 9. Quality of
questions in a questionnaire |
Able to
do or use: "1. Target populations 2. Representative samples 3.
Probability as a measure of uncertainty 4. Randomness 5. Variability 6.
Evidence and inference for decision making 7. Reduction of bias in
sampling 8. Reduction in bias in measuring 9. Contexts.
" |
|
NUMERACY
(NNN) JOURNAL |
Numeracy is an open-access, peer-reviewed
journal launched in 2008. Numeracy aims to support
education at all levels that integrates quantitative skills across
disciplines. The journal seeks evidence-based articles. See Vacher's
NECQL and
PKAL presentations. |
Len Vacher (left) and Dorothy Wallace (right)
are editors of Numeracy: Advancing Education in Quantitative
Literacy published by the National
Numeracy Network, supported by U. of S. Florida Libraries and hosted
by
the Berkeley Electronic Press™. |
-
Five
Thousand Downloads, H L Vacher
-
Confessions of a Weak Tie, Joel Best
-
A
Rubric for Assessing Q/R in Written Arguments Grawe, Lutsky,
Tassava
-
Envisioning a Quantitative Studies Center Karaali, Choi, Sood,
Grosfils
-
Are Statistics Labs Worth the Effort? Guardiola, Nadina Duran,
Elsalloukh
-
An Activity Promoting the Practice of Q/L for Pre– and In–Service
Teachers of Mathematics and Science Sorey, Willard, and Sholz
-
College Algebra in Context: Project Incorporating Social Issues,
Catalano
- Perspective:
Numeracy: Open-Access Publishing to Reduce the Cost of Scholarly
Journals, Todd A. Chavez
- Book Reviews
Two
Popular Books for Quantitative Literacy: What the Numbers Say, and
The Numbers Game, Robert G. Root
- Column
Parts of the Whole: Observing the State of the System, Wallace
|
|
2010 QR/QL INITIATIVES |
|
"quantitative reasoning skills are essential
for all citizens to help them understand and critically evaluate
information to make better-informed decisions. UTSA’s Quality
Enhancement Plan (QEP): Quantitative Scholarship: From Literacy to
Mastery addresses this critical need by providing students with
quantitative skills through an enhanced curriculum focused on contextual
learning ..." |
"The QEP
envisions the creation of an exemplary program ... where quantitative
reasoning skills are ingrained in not only the curriculum, but also the
culture of UTSA." "UTSA's Teaching and Learning Center will
organize summer workshops to help faculty design active learning
exercises in their courses." Nandini Kannan, a
Fellow of the ASA, is
the project director. |
2010 NSF QR/QL GRANTS |
|
NSF
awards $190,778 to the U. of Mass-Boston for "developing,
assessing, and disseminating materials for teaching a QR course...driven by complex stories about, for
example, inflation, fuel economy, and paying off debt" "to develop students' willingness and ability to
assess numerical evidence in order to make informed decisions." PI:
Maura Mast. Two-year grant
0942186. |
NSF awards mentioning these phrases by start-year (2010, 09, 08, 07): numeracy (2,3,6,1), quantitative
reasoning (5,3,4,4), quantitative literacy (3,5,6,2), statistical
thinking (4,2,0,1), statistical
reasoning (2,0,0,0) and statistical literacy (0,0,0,0). NSF
database totals:
numeracy (13),
QR (16),
QL (18),
ST (7),
SR (4) and
SL (0). |
|
NSF awards
Morehouse College a $499,828 three-year grant to "assess ... a students'
critical scientific thinking and understanding. Scientific
literacy involves "an understanding of the nature and development of
scientific research and knowledge; possessing the ability to evaluate
scientific evidence and explanations; etc. " PI:
Lycurgus Muldrow and
Bryant Marks (picture). NSF grant
1036269. |
NSF awards $174,999 to Wesleyan for an "inquiry-based,
supportive approach to statistical reasoning." The curriculum
involves "opportunities
to analyze data in real world contexts, and education about statistical
concepts through computing. Data analysis "represents 50% of the
student's semester curriculum." PI:
Lisa Dierker
and David Beveridge. One-year award
0942246. |
|
NSF awards
$144,704 to
the Univ. of Pennsylvania to "develop a new, more interpretable
sensitivity analysis for IV [instrumental variable] studies that is calibrated to observed
covariates. A new way of designing IV studies to make the study less
sensitive to the proposed IV being invalid (i.e., correlated with
unmeasured confounders) also will be developed." PI:
Dylan Small.
3 year grant 0961971. |
NSF awards
$103,077 to
Duke Univ. to study Models and Causal Structure in Econometric Analysis.
"The proposed research is a philosophical study of how theoretical and
statistical models (including
models used to measure economic phenomena) interact to produce causal
knowledge of the economy." PI:
Kevin Hoover. 1 year
grant 1026983. |
|
NSF awards
$172,280 to Ohio State "to test the
relations between numeracy and intuitive representations of numbers and
to test their separable influences in a variety of decision contexts." " This
research may add substantially to our understanding of the psychological
mechanisms underlying decisions that involve numeric information."
PI:
Ellen Peters.
1 year grant 1047757. |
NSF awards
$323,030 to Berkley to conduct experiments on the "Sampling Hypothesis"
and explore how "evidence and prior beliefs shape the samples of
possible beliefs" that children explore and discard. PIs:
Alison Gopnik and
Thomas Griffiths.
Grant: 1023875. |
|
CAREER: Supporting Students' Proof Practices
Through Quantitative Reasoning in Algebra. NSF awards $100,572 to
the U. of Wisconsin-Madison "to explore the hypothesis that a
curricular focus on quantitative reasoning in middle grades mathematics
can enhance development of student skill and understanding about
mathematical proof." PI:
Amy Ellis. One-year grant
0952415. |
NSF
awards Illinois Institute of Technology a $366,227 grant
to study "pre-K students' development of quantitative reasoning through
measurement. This builds on the pre-numeric stage of instruction found in
the Elkonin-Davydov (E-D) elementary mathematics curriculum from
Russia." PI:
Zaur Berkaliev
(IIT) and
Barbara Dougherty
(ISU). Two-year grant 1020207. |
NEWS |
|
Jesse Wilkins
Virginia Polytechnic: "To assess quantitative literacy, it is
important to devise measurement tools that provide valid and reliable
information... In this study, exploratory factor analysis and
confirmatory factor analysis were used to build and evaluate a
measurement model of quantitative literacy. The results ... supported
the structure of the hierarchical three-factor model." |
The
Atlanta FRB: "We find a large and statistically significant negative
correlation between numerical ability and various measures of
[mortgage] delinquency and default. The result is
robust to controlling for a broad set of socio-demographic variables and
not driven by other aspects of cognitive ability." Working paper 2010-10 by
Gerardi
(left), Goette and Meier. |
|
PhD Thesis by Namika Sagara
while at U. Oregon. "Numeric information is
presented to consumers to communicate important and precise
information." Experiments showed that participants "were susceptible to
an Illusion-of-Numeric-Truth effect: they judged false claim as true
when numeric meaning was inaccurately translated (e.g., "30% of
consumers" translated to "most consumers"). |
Delving Deeper: Sizing Up Class Size: A
Deeper Classroom Investigation of Central Tendency By Larry Lesser
-- published in
The Mathematics Teacher. An investigation of average
class size introduces the difference between mean-per-class and
mean-per-student. Learn about self-weighted means and the inspection
paradox. Dec. 2009, Vol 103, Issue 5, P. 376. |
|
John Myles White:
Three-quarter truth: "no idea has stifled the growth of
statistical literacy as much as the endless repetition of the words
correlation is not causation. This phrase seems to be primarily used to
suppress intellectual inquiry by encouraging the unspoken assumption
that correlational knowledge is somehow an inferior form of knowledge."
Copy |
Steven Strogatz (Cornell)
NYTimes 4/25: Perhaps the most pulse-quickening topic of all
is “conditional probability”. "consider the probability that a man
murdered his ex-wife, given that he previously battered her. ...
The real question is: What’s the probability that a man murdered his
ex-wife, given that he previously battered her and she was murdered...?" |
|
30 Classroom-ready activities that
emphasize exploration, investigation, reasoning, and communication in
mathematics. This book offers teachers and teacher educators
practical ideas for incorporating graph reading and quantitative
literacy into instructional programs. Activities include objectives,
vocabulary, materials, questions for discussion, and ideas for
summarizing..." |
 Teaching
With Data is a portal where faculty can find resources and
ideas to reduce the challenges of bringing real data into post-secondary
classes. Using real data is a great way for students to become more
engaged in the content of a course, but significant barriers, largely in
terms instructor preparation, exist that can make using data a
challenge. Teaching
With Data is a portal where faculty can find resources and
ideas to reduce the challenges of bringing real data into post-secondary
classes. Using real data is a great way for students to become more
engaged in the content of a course, but significant barriers, largely in
terms instructor preparation, exist that can make using data a
challenge. |
|
Evaluating Statistical
Reasoning of College Students in the Social and Health Sciences with
Cognitive Diagnostic Assessment by
Ying Cui (right), Mary Roberts and Andrea Gotzmann (CRAME,
Univ. of Alberta). Goal: "to discuss the usefulness of new
cognitive diagnostic assessments in helping evaluate and improve
students’ statistical reasoning in social and health sciences." |
How Sociological Leaders Rank Learning Goals for Introductory Sociology.
by Caroline
Hodges Persell (New York Univ., Dept of Sociology) E-mail:
caroline.persell@nyu.edu Leading sociologists rank the
top 30 learning goals, The top 4 goals were to (1) show the
reality of structural factors in social life, (2) place an issue in a
larger context, (3) identify and offer explanations for social
inequality, (4) recognize the difference between empirical and normative
statements. See Persell (2006 and 2007). |
NEW BOOKS: TRADE/ACADEMIC |
|
Integrating Critical Literacy and Critical Numeracy in K-8 Classrooms
by David
and Phyllis
Whitin (NCTE, Routledge). "If students are to be the kinds of critics
who are essential to the civic discourse of a democracy, they must come
to understand how people use numbers to wield power, promote arguments,
and influence public policy" Without context, math is "a field of
abstract calculations."
Preface |
Charles Seife introduces Potemkin numbers (deliberately deceptive statistics),
“disestimation” (turning a number into a falsehood by taking it too
literally), fruit-packing (deceptive techniques including
cherry-picking data and comparing apples to oranges), and “randumbness”
(finding causality in random events). "admirable salvo against
quantitative bamboozlement by media and government" |
|
By Sanjoy Mahajan,
"In problem solving, as in street fighting, rules are for fools: do
whatever works--don't just stand there! Yet we often fear an unjustified
leap even though it may land us on a correct result. Traditional
mathematics teaching is largely about solving exactly stated problems
exactly, yet life often hands us partly defined problems needing only
moderately accurate solutions. This engaging book is an antidote to the
rigor mortis brought on by too much mathematical rigor, teaching us how
to guess answers without needing a proof or an exact calculation."
Site. |
The definitive report on the
overall well-being of all Americans. How are Americans doing—compared to
one another and compared to the rest of the world? This fully
illustrated report, with over 130 color images, is based on the
groundbreaking American Human Development Index, which provides a single
measure of the well-being for all Americans, disaggregated by state and
congressional district, as well as by race, gender, and ethnicity. The
Index rankings ... reveal huge disparities.... |
|
Kaiser Fung:
"These are the statistics that rule your life, your job, your commute,
your vacation, your food, your health, your money, and your success.
This is how engineers calculate your quality of living, how corporations
determine your needs, and how politicians estimate your opinions. These
are the numbers you never think about-even though they play a crucial
role in ... your life." |
More
on Numbers in our World
Atlas of the Real World. Dorling, Newman
and Barford.
Atlas of World Hunger,
Bassett
and Winter-Nelson
Mis-measuring Our Lives: Why GDP Doesn't Add Up, Stiglitz, Fitoussi
The Haves and the Have-Nots: (Brief History of Inequality),
Milanovic |
|
Bias and Causation: Models and Judgment for Valid Comparisons by
Herbert I. Weisberg.
Treats bias in comparative studies—both randomized and observational.
Explains selection bias, confounding, intermediate causal factors, and
information bias along with the distortion of a causal effect that can
result from measurement error. A new classification of twenty sources of
bias. Prose award. |
More on Statistics
Making Sense of Statistics: A Conceptual Overview pb. Fred Pyrczak
(5th ed)
Elementary Statistics: Looking at the Big Picture Hc by Nancy Pfenning
Statistical Learning from a Regression Perspective pb Richard Berk
Biostatistical Methods: The Assessment of Relative Risks Hc. John
Lachin (2nd ed.)
Social Statistics: The Basics and Beyond, Thomas J. Linneman |
|
Wall Street Journal Guide to Information Graphics: The Dos and
Don'ts of Presenting Data, Facts, and Figures Hc. by Dona
Wong. "“An essential reference for anyone who needs to effectively
convey quantitative information using graphs." "blends lessons on data
analysis and graphic design" "Wong’s professional advice advances
the art of information graphics." |
More
on Graphics and Graphs
Beautiful Visualization: Looking at Data through the Eyes of Experts
pb. Julie Steele, Noah Iliinsky
Cartographies of Time: A History of the Timeline by Anthony Grafton
and Daniel Rosenberg
Visual Meetings: How Graphics, Sticky Notes and Idea Mapping Can
Transform Group Productivity by David Sibbet
|
|
International Differences in Well-Being (Positive Psychology) by Ed
Diener. Daniel Kahneman and John Helliwell. "using subjective
well-being data to understand and compare well-being across countries
and cultures." "bulk of ... large international differences in
life evaluations are due to differences in life circumstances rather
than differences in the way these differences are evaluated." |
More on Statistical Indicators and Metrics
Community Quality-of-Life Indicators: Best Cases II (Social
Indicators Research Series) Pb. Editors: M. Joseph Sirgy, D. Rahtz,
David Swain.
Presimetrics: What the Facts Tell Us About How the Presidents Measure Up
On the Issues We Care About by Mike Kimel, M. Kanell, and
N. Holmes
Data-Driven Marketing: The 15 Metrics Everyone in Marketing Should Know
by Mark Jeffery
|
|
Wrong: Why experts keep failing us--and how to know when not to trust
them [Hc] David H. Freedman.
The Upside of Irrationality: The Unexpected Benefits of
Defying Logic at Work and at Home by Dan
Ariely.
See also
The Quants: How a New Breed of Math Whizzes Conquered Wall Street and
Nearly Destroyed It by Scott Patterson
|
More on Statistics In Science
Bad Science: Quacks, Hacks, and Big Pharma Flacks by Ben Goldacre
Being Wrong: Adventures in the Margin of Error Hc Kathryn Schulz
How Many Friends Does One Person Need?: Dunbars Number and Other
Evolutionary Quirks [Hardcover] Prof. Robin Dunbar
Street-Fighting Mathematics: The Art of Educated Guessing and
Opportunistic Problem Solving by Sanjoy Mahajan and Carver Mead |
|
Bursts: The Hidden Pattern Behind Everything We Do by Albert-László
Barabási. The narrative structure of Barabási's provocative book
... converge on a single theme: that our unthinking behaviors are
governed by a deeper meaning that can only be deciphered through the
brave lens of mathematics." |
More on Choice & Decision Theory
Prospect Theory: For Risk and Ambiguity by Peter Wakker.
Rational Choice Hc. Itzhak Gilboa;
How We Decide Pb. Jonah Lehrer
How We Think: A Theory of Goal-Oriented Decision Making and its
Educational Applications Pb. by Alan H. Schoenfeld.
Numbers Rule: Vexing Math of Democracy by George Szpiro
Prose Award |
|
Carl Elliot's
White Coats; Black Hats: Adventures on the Dark Side of Medicine.
Elliott’s book describes the conundrum of modern medical practice [the
adverse effects of mixing capitalism with the practice of medicine]
wittily, incisively, and beautifully. This book should be required
reading for anyone who has ever been a patient—in other words, for
everyone." |
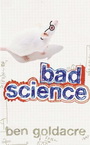 Bad
Science-Quacks, Hacks, Flacks Bad
Science-Quacks, Hacks, Flacks
"British doctor Goldacre is funny and blunt as he
bashes journalists, nutritionists, homeopaths, politicians, and
pharmaceutical companies—his favorite targets." "Bad Science is...
a toolkit for critical thinking, a primer on statistics and valid study
design, a guide to meta-analysis and other tools for uncovering and
understanding truth . . . should be required reading for
everyone... " US edition |
|
By David A Freedman. "a definitive synthesis
of his approach to causal inference in the social sciences. Freedman maintains that many new technical
approaches to statistical modeling constitute not progress, but regress.
Instead, he
advocates a 'shoe leather' methodology, which exploits natural variation
to mitigate confounding and relies on intimate knowledge of the subject
matter ..." [Added 2012] |
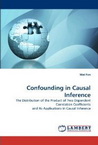 Confounding
in Causal Inference Confounding
in Causal Inference
By Wei Pan, Peking Univ. "Causal inference is an important but
controversial topic in the social sciences." This monograph "introduces a reference distribution of the
confounding that is the product of two dependent correlation
coefficients and illustrates how to use the reference distribution to
investigate the robustness of a cause inference to the impact of a
confounding variable."
[Added 2012] |
|
Research Methods in Practice: Strategies for
Description and Causation by
Dahlia Remler and Gregg Van Ryzin. "Covers strategies
for both description and causal estimation." "Appropriate for graduate-level students "
Ch 11: Observational studies ...
TOC |
Doing Bayesian Data Analysis: A Tutorial with R and BUGS by John
Kruschke. "provides an accessible approach to Bayesian Data Analysis, as
material is explained clearly with concrete examples. "
"These methods may help us to avoid publishing studies that are not
likely to replicate." Psychology Today Blog. |
|
The Numbers Guy: 2010 |
 Carl
Bialik Carl
Bialik
Carl Bialik, the Wall Street Journal
"Numbers Guy," went "ballistic" with more than
100 articles in 2010
compared to 63 in 2009, 24
in 2008, 11 in 2007 and 23 in 2006. He co-writes The Daily Fix, a sports column
that appears each weekday morning on WSJ.com. Carl has a degree in
mathematics and physics from Yale University. Check out
his WSJ blog. |
Calculating Pay Inequality
How big is the gender gap in pay between
men and women? The answer ... depends on how you measure How the
group of workers is defined also matters. In the U.K., the Government
Equalities Office cited a bigger pay gap by combining full-time and
part-time workers, sparking a rebuke from the UK Statistics Authority.
The difference is an example of a Simpson’s Paradox, in which an overall
difference is bigger than the gap between any subgroup. |
|
Amazon Best Selling Books in Math |
|
Amazon Top 100
Books in Applied Math
Amazon bestsellers in
Science>Math>Applied. Top 10:
#1. Freakonomics (and Other
Riddles of Modern Life) Levitt, Dubner [HC]
#2. The
Calculus Diaries: How Math Can Help You Lose Weight, Win in Vegas, and
Survive a Zombie Apocalypse, Jennifer Ouellette
#3. How to Measure
Anything: Value of Intangibles in Business,
Hubbard
#4. The Visual Display of Quantitative Information, 2nd ed.,
by Tufte
#5. Secrets of Mental Math: Mathemagician's Guide, Benjamin & Shermer
#6. Research Design: Qualitative, Quantitative & Mixed Methods, Creswell
#7. How to Lie with Statistics by
Darrell Huff
#8. Secrets of Mental Math: Mathemagician's Guide, Shermer [Kindle]
#9. Cartoon Guide to Statistics by Larry Gonick, Woollcott Smith
#10.
Statistics for Dummies by Deborah Rumsey |
Amazon Top 100 Books in Statistics
Amazon bestsellers in
Science>Mathematics>Applied>Statistics. Top 10:
Note: Amazon treats sales via Kindle as separate items.
#1 The Visual Display of Quantitative Information, 2nd ed. by Tufte.
#2.
Research Design: Qualitative, Quantitative & Mixed Methods Creswell
#3. How to Measure Anything: Valuing
Intangibles in Business, Hubbard.
#4. Envisioning Information
by Edward R. Tufte.
#5. Fooled by Randomness: The Hidden Role of Chance, Taleb [Kindle].
#6. Cartoon Guide
to Statistics by Larry Gonick, Woollcott Smith.
#7. Fooled by Randomness:
The Hidden Role of Chance by Nassim Taleb.
#8. How to Lie with Statistics by Darrell Huff and Irving Geis.
#9.
Discovering Statistics Using SPSS by
Andy Field.
#10. Now You See It: Simple Visualization Techniques by Stephen Few. |
|
|
|
Susan Elrod (PKAL) and
Nathan
Grawe
hosted
Quantifying
QR in Undergraduate Education: Alternative
Strategies for the Assessment of Quantitative Reasoning.
Nathan talked on
Other Important
Things I've Learned from Reading Student Papers" |
  NNN
Annual Meeting NNN
Annual Meeting
Corri
Taylor (NNN President) convened the 2010 board meeting of the
National Numeracy Network (NNN).
Taylor,
Schield and Hillyard were re-elected for another
year. Len Vacher (right) talked about Numeracy: the
NNN's online, open-access, peer-reviewed journal.
|
|
Bernie
Madison (left) and Shannon Dingmann (right) (Univ. Arkansas) presented
"Quantitative Reasoning: Some Evidence and Questions on Learning."
Together they introduced findings from their unique news-based course.
Bernie is the
PI of QR in the
Contemporary World. |
In the breakout session, John Schmit
(left, Augsburg) talked on "Teaching Statistical Literacy as a Quantitative
Rhetoric Course" 4up. Marc Isaacson (Augsburg,
right) talked on Statistical Literacy @ Augsburg.
6up. |
|
Sue
Mente (left) presented "The Alverno Story."
6up.
Caren Diefenderfer
(right,
Hollins) presented
"Generating Interdisciplinary Institutional Buy In" 6up. |
Milo Schield (left, NNN Vice-President) presented "Quantitative Literacy
Today" as one of the two keynote talks. 6up.
In the breakout session, Milo talked about Augsburg's Statistical
Literacy course. 6up
Eric
Gaze (right) presented "The QR Program at Bowdoin College"
6up,
4up.
|
|
STATS |
 Trevor
Butterworth, editor of STATS, contributes to the
Financial Times, Forbes, and the Wall Street Journal. Trevor
Butterworth, editor of STATS, contributes to the
Financial Times, Forbes, and the Wall Street Journal.
Pay more tax and cheat death!
"a 10% increase in alcohol prices would result in a 5% reduction in
drinking"
Study finds lower incidence of autism in vaccinated kids
Teflon and Thyroidism |
 Rebecca
Goldin, STATS Director of Research, is on the
Mathematics faculty at George Mason University. Rebecca
Goldin, STATS Director of Research, is on the
Mathematics faculty at George Mason University.
The flu: It’s about variance
Rebecca Goldin
Goldin and Merrick
Science minus women equals biology?
STATS: We want people to
think about the numbers behind the news.
Stats essays for
2010. |
|
GENERAL NEWS |
|
"a required statistical literacy course of some sort for all college
students (and probably for high school students as well) is a great
idea. Some colleges do this, but many do not. The lack of such a
universal requirement keeps the public at large in the dark when
statistics is purposefully abused to suit certain people's purposes
rather than used to arrive at the truth." "Regardless of career, a
person needs some knowledge of statistical literacy to be able to make
sense of reports about statistical studies and to detect misuses or
abuses of statistics. Such skills will serve anyone well, regardless of
the person's career. The lack of basic statistical literacy among the
public at large means that many people are fleeced all the time by
statistical studies that don't mean anything." Jonathan Groves:
Posted: Apr
14, 2010 12:06 PM |
Common Core
Bernie Madison: "I do not believe CCSSM goes far enough to support
education for citizenship. At the ACE review meeting I suggested that in
addition to college and career, we should add citizenship. The community
is not ready for that, evidently, for two reasons I believe. We do not
have a clear agreed-to description of what QR/QL is needed for
citizenship, and we do not know how that QR/QL will integrate with
college and career needs.
The insertion of probability and statistics
into the K-12 mathematics strand has been and is still being resisted.
Some believe there is not room for more. We are having some success with
teachers in workshops to use media articles as a source of classroom
studies. That would help." |
|
|
|
ALM Journal: 2010
Correcting Students’ Misconceptions about Probability in an Introductory
College Statistics Course by Leonid Khazanov, Lucio Prado.
People’s mathematics in working life: Why is it invisible? Tine
Wedege |
Challenges in Designing and Implementing a College
Competency Requirement in Quantitative Reasoning
Tibor Marcinek and Ana Dias
CMU
Defining Numeracy – the story continues
David Kaye
The adult numeracy conundrum
Chris Klinger
|
|
UK Statistical Publications |
|
Edward Simpson: Bayes at Bletchley Park.
Edward Simpson (right) also wrote "Measurement
of Diversity" in 1949 [aka "Simpsons Diversity Index"] and wrote
"The interpretation of interaction in contingency tables" in 1951 [aka
"Simpson's paradox"].
|
A Website That Provides Resources for Assessing Students’ Statistical
Literacy, Reasoning and Thinking. P2. Joan Garfield and Robert
delMas The Assessment Resource Tools for Improving Statistical Thinking
(ARTIST) Web site was developed to provide high-quality assessment
resources for faculty who teach statistics |
|
QUOTES |
|
STATISTICAL LITERACY DEFINED
-
"Statistical literacy is essential for both effective citizenship
and personal well-being" "Statistical literacy [is] the
understanding and use of the language and tools of statistics."
Stat Act of 2010, HR 6355
Condensed
-
Statistical literacy: "The set of basic statistical skills (and
scepticism) that people need to deal with information in their
everyday lives."
Michael
Pace Ross, Director General Malt NSO.
-
"Statistical literacy is the bridge between numerical information
and social meaning." John Schmit PKAL Oct 2010
4up
-
"Statistical literacy is the ability
to read and interpret summary statistics in the everyday media: in
graphs, tables, statements, surveys and studies. Statistical
literacy is needed by data consumers." Milo Schield in "Assessing
Statistical Literacy: Take CARE" in
Assessment Methods in Statistical Education: An International
Perspective (Wiley, 2010).
Excerpts
STATISTICAL LITERACY IMPACT
-
Journalists of the future must be math-literate: "Without
statistical literacy, we will just be writing fiction."
Blog Allison Martell
Jan 2010
-
People have a lot more numbers [today].... But they don't
necessarily have the statistical literacy to go with it."
Katherine Wallman, US Chief Statistician in
Science News (11/2010).
-
Statistical literacy has risen to the
top of my advocacy list, right alongside numeracy, and perhaps even
ahead of “algebra for all.” J. Michael Shaughnessy, NCTM President.
Statistics
for All.
-
"no idea
has stifled the growth of statistical literacy as much as the
endless repetition of the words correlation is not causation. This
phrase seems to be primarily used to suppress intellectual inquiry
by encouraging the unspoken assumption that correlational knowledge
is somehow an inferior form of knowledge." Correlation
MAY BE causation by
John Myles White
-
"a required statistical literacy course of
some sort for all college students (and probably for high school
students as well) is a great idea. Some colleges do this, but many
do not. The lack of such a universal requirement keeps the public at
large in the dark when statistics is purposefully abused to suit
certain people's purposes rather than used to arrive at the truth."
Jonathan Groves: Required Statistical Literacy Course for All
Students? Posted: Apr 14, 2010 12:06 PM
Math Forum@Drexel.
-
“It is impossible to rank schools on performance in NAPLAN [The
National Assessment Program – Literacy and Numeracy] when the
variables that influence performance are so many and varied."
David Johns, Hennessy Catholic College, Young AU.
Young Witness
-
"Statistical literacy is vital to citizenship, and particularly
students engaged in non-quantitative majors for whom advanced
statistical reasoning, without resort to formal advanced statistical
analysis, is becoming ever more important."
Ridgway,
Nicholson & McCusker ICOTS
OTHER
|
|
International
Statistical Literacy Poster Project |
|
Reija Helenius (right) is the new Director of
the ISLP from 2009-2012 along with colleagues Dr Pedro Campos (Portugal)
and Dr Sharleen Forbes (New Zealand). "An ISLP advisory board will
assist us in our work. All of us aim to improve statistical literacy
worldwide." Presented
Improving statistical literacy by national and international cooperation"
at ICOTS-8. |
The US is conducting a national poster competition
under the auspices of the International Statistical Literacy project (ISLP). The US team involves Kathryn
Hall, Dean Johnson, Rose Martinez-Dawson and Ashley Steel.
Milo Schield (right) is the US Coordinator. For more information, see
www.StatLit.org/US-ISLP.htm. |
|
ICOTS-8
PLENARIES |
|
ICOTS-8 was held in Ljubljana, Slovenia.
Andrej Blejec (Slovenia), chair of the local organizing committee, was in
charge. Keynote videos. |
In his keynote address "Toward
an Evidence Based Society",
Gerg Gigerenzer (Max Planck Institute for Human Development) called
for statistical literacy: representations that foster insight.
Gigerenzer advocated replacing five-year survival rates with mortality
rates, replacing conditional probabilities with natural frequencies and
replacing relative risks with absolute risks.
Video |
|
Hans Rosling, founder of GapMinder, argued "If you show the core numbers
of statistics, rather than the meaning of the data, your audience will
be small." "Animated displays of time series do not replace any
other form of data presentation. Its aim is to attract new user groups
to the beauty of statistics. I will review what it will take to bring
statistical databases into prime time TV."
Video. |
The Strength of Evidence vs the Power of Belief: Are we all
Bayesians? Psi studies provide a natural context for
Bayesian analysis, in which prior beliefs can easily be
incorporated. Tests of psychic abilities can be an interesting
and entertaining way to teach many different concepts at varying
levels of statistics courses [such as the concept of power].
Video |
|
ICOTS-8
STATISTICAL LITERACY |
|
Milo Schield, Director of the W. M. Keck Statistical Literacy Project,
organized a session on Statistical Literacy for Students in
Non-Quantitative majors. This includes about 40% of recent US
college graduates. Milo also presented
Association-Causation Problems in
News Stories. This paper investigates inaccuracies, omissions and
ambiguities in number-based news stories.
Slides. |
Using a Five Step Framework
for interpreting tables and graphs in their contexts: Marian
Kemp and Barry Kissane (Australia) Step 1: Get started. Step
2: What do they mean? Step 3: How do they vary [within a
series]?
Step 4: Where are the differences [between two series]? Step 5: Why do
they differ? |
|
Using media reports to promote statistical literacy for non-quantitative
majors by Stephanie Budgett (right) and Maxine Pfannkuch (NZ).
Among the 6 students interviewed seven months after the course, they
found no meaningful difference between the quantitative and
non-quantitative students. There does however appear to be a
difference in the way the two groups explain their understanding."
|
How we can all learn to
think critically about data: Ian Gordon, Sue Finch (Australia).
We considered "a problem-based approach ..., but opted for a
topic-based approach." Students had "to make a detailed review of
a single research study" and compare it with the reporting ... in the
news item and in the published article." |
|
Luring non-quantitative
majors into advanced statistical reasoning (and luring statistics
educators into real statistics): Sean McCusker (right), Jim
Ridgway, James Nicholson. Goal: "to extend students’ activity
beyond simple descriptive and inferential statistics which often relate
to just two variables, to key [multivariate] statistical ideas such as
effect size and interaction." |
Making Sense of Statistical Studies: A Capstone Experience for
Secondary Students by Roxy Peck and Daren
Starnes. "investigations start with a research question on some
topic of interest. Students are then led through a series of
questions that help them examine the study design, analyze data, and
interpret results" Three contexts: observational studies, surveys & experiments. |
|
Statistics Assessment: The Good, the Bad and the Ugly. by James
Nicholson (left), Jim Ridgway and Sean McKusker. Given data,
students created reports. Over 80% of the reports used data, with
about 60% using it accurately and appropriately. Just over 20% described
trends in a clear and accurate manner.... About 15% of the reports made
mention of 2-way interactions..." |
Pupils Reasoning with Information and Misinformation by Jim
Ridgway (left) and James Nicholson. "Thirteen out of 90
responses actually showed evidence that students could discuss
two-way interactions. The idea of interaction is central to
understanding most real world problems..." |
|
Rebecca Goldin (GMU and advisor to STATS), presented "Spinning Heads and Spinning
News: the American Media's Gap in Quantitative Reasoning."
It is a challenging task to increase statistical savvy in the public
forum. As statistics educators in an increasingly
data-driven society, we need to be aware that our impact is far greater
than it used to be, and far more important. |
Unintentional Lies in the Media: Don't Blame Journalists for What We
Don't Teach. Jessica Utts. As statistics educators, we
need to do a better job of educating our students to write these
stories (as future journalists), to interpret them for
decision-making (as future ... professionals) and to read them with
a critical eye (as future consumers of information). |
|
Assessing the Interpretation of Two-Way Tables as Part of Statistical
Literacy by Jane Watson (right) and Erica Nathan. "Most teachers
(17/29) revealed a partial understanding only of the “Big Ideas”
inherent in the 2-way table, and were unable to articulate its learning
potential immediately." "this is all about proportional
thinking obviously" |
Post Secondary and Adult Statistical Literacy: Assessing Beyond the
Classroom by Jenifer Kaplan (right) and Justin Thorpe. "This paper
defines adult statistical literacy as the set of skills and
knowledge used by expert consumers of statistics and then provides a
potential framework, based in the literature, to describe the
components of statistical literacy." |
|
Improving Statistical Literacy by National and International
Cooperation by Reija Helenius. "The promotion of
statistical literacy and awareness represent a strategic goal of
each statistical office. A set of statistics does not become
endowed with a meaning until it finds its user and is capable of
adding value to the activity of the user of the information."
|
Promoting Statistical Literacy: A European Pilot Project to Bring
Official Statistics Into University and Secondary School Classrooms
by Hans-Joachim Mittag (University of Hagen, Germany). This
paper presents an EU-funded project that aims at promoting
statistical literacy amongst young people by providing an innovative
e-course with interactive and dynamic components. |
|
Developmental Changes in Australian School Students' Interest for
Statistical Literacy by Colin Carmichael (right) and Ian Hay (U.
Tasmania). "younger students are more likely to be interested in
activities related to chance and the use of computers. Older students,
on the other hand, are more likely to value the ability to interpret
statistics in media and scientific contexts." |
  Workshops Workshops
Jane Watson and Milo Schield held mid-day workshops. Jane
talked on critical numeracy. Milo presented "Statistical Literacy
2010: An Update."
Slides. He elaborated on his article "Assessing
Statistical Literacy: Take CARE." |
|
Teachers’ perceptions of best practice in statistical literacy education by Ian Hay (U.
Tasmania). "teacher interviews were tape-recorded an d transcribed.
These transcripts were then entered into the software package Leximancer.
The Leximancer program “reads” the text and creates a map that is
comprised of a set of ‘concepts." |
Karen Francois
(left) and Jean Paul Van Bendegem (Free University Brussels, Belgium)
presented "Ethical-political
aspects of statistical literacy." They introduced ISOTYPE (a
graphical-visual language): "one of the most innovative approaches to
the representation of statistics in such a way that the greatest
accessibility can be guaranteed." "mainly used for societal matters." |
|
ICOTS-8
OTHER |
|
One Hundred Years of Progress-Teaching Statistics: 1910-2010. What
Have we Learned? Part 1 and
Part 2. Neville Davies, Vic Barnett and John Marriott.
"statistics is ... a branch of science. Statistical numeracy
requires ... a commonsense approach to the use of data in supporting
an argument, ... and a judicious understanding of ...concepts
such as means and percentages. part of everyday living." |
Effect Sizes and Confidence Intervals for Multivariate Analysis: How
Complete are Published Accounts of Research in Psychology? by
Fiona Fidler (right), Harlow, Cumming and Abbott. "The only
consistent finding was an unfortunate one: CIs [confidence
intervals] are exceptionally rare!" See
The APA Publication Manual 6th Ed: Implications for Statistical
Education by Fidler. |
|
Statistics Education in the Social and Behavioural Sciences: From
Dichotomous Thinking to Estimation Thinking and Meta-Analytic
Thinking by Geoff Cumming. estimation thinking (ET) and
meta-analytic thinking (MAT) focus on sizes of effects, and
cumulation of evidence to increase precision. A shift from DT
[deterministic thinking] to ET/MAT is highly desirable.
|
The Confidence Interval: A Difficult Matter, Even for Experts by
Gabriel Yáñez Canal and Roberto Behar Gutiérrez. Goal: "to
find out what a sample of experts (statisticians and statistics
university professors) and university students understood exactly by
confidence intervals. To this end, a questionnaire was answered by
41 experts and 297 students." |
|
Real-Life Module Statistics: A Happy Harvard Experiment by Kari
Lock and Xiao-Li Meng. "the course focus is on real-life
applications, not finding examples for the sake of illustrating
statistical techniques...." "By creating a course that applies
statistics to topics relevant to the students’ lives, we excite and
engage students and open their eyes to the power of statistics." |
Two related papers on informal inference among school children.
Chris Wild presented
Inferential Reasoning: Learning to "Make a Call" in Theory.
Maxine Pfannkuch presented
Inferential Reasoning: Learning to "Make a Call" in Practice. |
|
Some Arguments for Integration of Qualitative Methods into Business
Statistics Courses by Iddo Gal and Irena Ograjenšek.
"We argue for the introduction of a balanced mixed method approach
early in the process of studying business statistics, as a preferred
basis for developing business students’ ability to respond to
diverse types of real-life managerial challenges." |
Data Analysis: Linking Mathematics, Science and Social Studies
by Jerry Moreno. "It is through the GAISE Model that data analysis
links mathematics, science, and social studies and it is through the
GAISE Model that the scientific method in science and social studies
skills for evaluating the credibility and reliability of sources for
projects is enhanced and verified." |
|
Helping Teachers To make Effective use of Real-World Examples in
Statistics by
Helen Chick (left) and Robyn Pierce. Case study involving
primary school teachers (PST). "Finding ways to enhance
statistical content and pedagogical content knowledge is
particularly critical for teachers—especially including primary
teachers—who have limited experience in mathematics and statistics." |
Exploration and Induction Versus Confirmation and Deduction by
Kathryn Blackmond
Laskey (right, GMU) and Laura Martignon (U. Ludwigsburg).
Stochastic education itself can be ... a profoundly political
activity–in the sense of being intimately tied to environmental and
social issues. Sophisticated statistical arguments have been applied
to deeply controversial political issues. |
|
Jane Watson:
Educating for Statistical Literacy |
|
In 2010 Jane Watson was awarded the inaugural Mathematics Education
Research Group of Australasia MERGA Career Research Medal, which
recognized “an outstanding and long-running program of research in
mathematics education in general and chance and data education in
particular.” In 2007. Jane was elected "Fellow of the Academy of the
Social Sciences in Australia."
vitae |
|
|
Statistical literacy in the middle school: The relationship between
interest, self-efficacy and prior mathematics achievement.
Australian Jrnl Educational Psych. Vol 10,
2010, pp. 83-93. C. Carmichael, R. Callingham, Ian Hay
[right], J. Watson. How do age, prior achievement, gender, and
self-competency beliefs contribute to ... students’ interest
for statistical literacy? |
Creating a Measure of Middle School
Students' Interest in Statistical Literacy: Is it Possible?,
Colin Carmichael, Rosemary Callingham [left], Ian Hay, Jane Watson. Mathematics Education Research Journal V22, N3, Nov. 2010. |
|
Statistical
Education Research Journal (SERJ) |
|
On Conceptual Analysis as the Primary Qualitative
Approach to Statistics Education Research in Psychology
by
Agnes Petocz and Glenn Newberry. "Conceptual analysis, a fundamental
part of the scientific method and arguably the primary qualitative
method insofar as it is logically prior and equally applicable to all
other empirical research methods .. has been largely overlooked. |
Elementary School Teachers' Comprehension of Data
Displays by
Timothy Jacobbe (U.
Florida, left) and Robert Horton (Clemson U). The elementary
school teachers involved in this study generally had a low-level
comprehension of data displays. Teachers were proficient at
"reading the data" but were unsuccessful with questions assessing higher
level skills. |
|
Subject Matter Knowledge for Teaching Statistical
Associations by
Stephanie Casey. "Findings regarding the knowledge required
for teaching correlation coefficient are highlighted" Best fit
line and correlation coefficient were found to be the two
most-referenced topics involving statistical association. Association,
scatter-plot and two-way tables were involved much less often. |
Cognitive and Non-cognitive Factors Related to Students'
Statistics Achievement by Francesca Cheisa and
Caterina Primi (U Florence). Data was obtained from 487 psychology
students enrolled in undergraduate introductory statistics courses.
Data obtained using SATS, PMP and STARS. Data for the 327 students
passing the final exam was analyzed. |
|
ASA Journal of Statistical
Education (JSE) |
|
Lexical Ambiguity in Statistics: How students use and
define the words: association, average, confidence, random and spread
by Jennifer Kaplan (right), Diane Fisher and Neal Rogness.
Forty-nine students wrote sentences and definitions for the statistical
meanings of the words. Less than a fourth of the students "were able to
define association as a relationship between two variables."
JSE |
The
Effects of Data and Graph Type on Concepts and Visualizations of
Variability by
Linda Cooper and Felice Shore. "we present basic
misconceptions found in the literature that hinder students’ abilities
to interpret and compare some types of graphs." Problem
distinguishing between distribution bar graphs and value bar charts if
frequency is found on the vertical axis...
JSE |
|
"Telling Data Stories: Essential Dialogues for Comparative Reasoning
association as a relationship between two variables" by Pfannkuch
et al. "this paper we discuss some of the major issues surrounding
story telling in statistics, challenge current practices, open debates
about what constitutes good verbalization of structure in graphical and
numerical summaries"
JSE |
PhD dissertation. By Barbara Wade. Knowing how important
statistical literacy is, the purpose of this research was to measure
statistical literacy in adult learners before and after they have
completed a statistics class, or a research methods class with no prior
statistics, or a research methods class with prior statistics.
Table of
Contents and Ch 1 excerpt.
Thesis.
See also
Confronting Statistical Literacy in the Undergraduate Social Science
Curriculum by Wade and Goodfellow. |
|
ASA:
Statistical Literacy |
  Statistical
Literacy Statistical
Literacy
Milo Schield (Augsburg) organized the 13th
session on statistical literacy with 90 attendees. He talked on
"The Social Construction of
Rankings." Milo
argued that teaching rankings was a good way to show the importance of
assumptions on simple numbers with minimal math.
6up |
John Schmit (Augsburg College) presented "Teaching
Statistical Literacy as Quantitative Rhetoric." "Statistical
literacy is a bridge between quantitative information and social
meaning. Quantitative rhetoric interrogates the strategies used to
create that meaning. ... statistical literacy ...should ... be
included in college general education programs.." 6up |
|
Statistical Literacy and Time-series Information by
Britt (left) and Anders
(right)
Wallgren "times-series data are more important to large groups
of users of statistical information than cross section data." "the
scope is how to get a good picture of qualitative patterns." 6up; |
Numbers in Everyday Life: A Short Course
for Adults by Gerald Hahn (left), Necip
Doganaksoy (right), Ricki Lewis, Jane Oppenlander and Josef Schmee
6up;
"We therefore needed to focus the course around the use and abuse of
statistics in specific application areas." [Voted #1] |
|
Probability in Decline
by Dean Brooks 6up; "Long
sequences of random digits generated by a variety of methods show
long-term declines in repetition of rare items or sequences." "Similar
decline patterns show up empirically in epidemiology, Web traffic, and
other probabilistic settings." "the strength of the argument lies in the
difficulty of finding ‘chance machines’ that do not exhibit decline." |
The Undetectable Difference: An
Experimental Look at the “Problem” of p-Values by Bill Goodman
6up;
"This paper explores the impacts on p-values, and alternatives, if
the null hypothesis is defined as a thick or thin range of values. It
also examines the extent to which the p-value may or may not be a good
predictor of the probability that H0 is true, given the distribution of
the data." |
|
ASA JSM |
  QL
& StatLit QL
& StatLit
Moving towards a QL core competency requirement by A. John
Bailer (left, Univ. Miami, Ohio). 6up
Roundtable: Statistical Literacy as a Separate Course from Introductory
Statistics by Robert Molnar (right) |
Understanding Students’ Attitudes toward Statistics: New
Perspectives Using an Expectancy-Value Model of Motivation
and the Survey of Attitudes Toward Statistics by
Caroline Ramirez, Esma Emmioglu and
Candace Schau
(right).
Assessing Students’ Attitudes: The
Good, the Bad, and the Ugly by
Anne Millar and
Candace Schau
(right). |
Frequentist -- not Bayesian
Statistical Inference, Statistics Education, and the
Fallacy of the Transposed Conditional by
Andrew Neath (S.
Illinois, Edwardsville). "The interpretations of significance testing
and confidence interval .. often presented to statistics students are
based on the "fallacy of the transposed conditional"." "the use of terms
such as "rejection" and "confidence", purposefully or not, are
misleading." |
Why do we study this? Critical Concepts
to Retain from Statistics Class by Kathryn Hall and
Diane K. Michelson.
"we should not be surprised that the content knowledge of a class ... is
forgotten after 6 months." "We had to expand the exercises from proofs
and formula manipulation to include the interpretation of the results
and correct decision making." |
Improve Business Statistics
Implementing Modern Pedagogical Guidelines in Business
Statistics: Challenges and Possible Solutions by Bodapati V. R.
Gandhi. "Making statistics relevant to students ... is not optional in
the business curriculum. It is the key to making them use statistics and
apply statistical reasoning in their professional career." |
Reform and Renewal in the Introductory Statistics Courses by
Nancy Leveille, Anna Simmons and Ron Barnes. "It is time to
eliminate or reformulate topics in the introductory statistics courses."
Misusing tables and charts "is an important topic." "Bayes’ Theorem and
conditional probabilities .. would be better" with decision
theory" "simple linear regression is usually .. the final
chapter." |
|
Web News |
Statistical Literacy, QL and QR
John Pullinger: The
RSS getstats statistical literacy campaign.
The RSS Statistical
Literacy Campaign.
Common mistakes
humans make in interpreting statistics (c.f., legal trials).
Bernie Madison at
ORC/OMSC. (6/2009).
QL1,
QL2,
QL3,
QL4,
QL5.
Alexaber Laskin:
Integrating Q/R in the Social Sciences Curriculum.
|
 Rosling
YouTube Videos Rosling
YouTube Videos
200 Countries, 200
Years, 4 Minutes 1.4M views 12/2010 Hans Rosling's lectures
reveal the story of the world's past, present and future development.
2020 Shaping Ideas
No more boring
data: TEDTalks
New insights on
poverty and life around the world
Global population
growth.
Asia's rise -- how
and when.
|
|
Who Counts?
A Marquette University project funded by a $631,661 grant from the U.S.
Department of Education Fund for the Improvement of Post-Secondary
Education (FIPSE). The goal of Who Counts is to encourage students to
retain and enhance quantitative reasoning skills for global social
justice by infusing math into non-STEM courses. Who Counts provided
curriculum development grants, faculty workshops, a multidisciplinary
reader, and prizes for student work. Over the 3-year period of the grant
(2008-2010), the nearly 2,000 students enrolled in over 30 Who Counts
courses showed significant improvement in their confidence in using
quantitative reasoning to analyze global and social justice issues.
|
Temple University: Statistics in the
News
Obituary: Burt Holland, professor at Temple University, died of ALS
on June 21. In 2006, Holland created "Statistics in the News" for
Temple's quantitative literacy program.
Temple QL Program: "IX. The quantitative literacy course is
intended to help students interpret phenomena in quantitative terms and
to understand the uses, limits, and abuses of quantification. It
contextualizes quantitative statements by encouraging students to think
about them as citizens rather than as specialists. These courses teach
quantitative reasoning, and while computation may be part of the course,
the primary focus is not the teaching of computational skills."
|
|
OTHER JOURNAL ARTICLES |
|
How to Win Without Overtly
Cheating: The Inverse Simpson Paradox By Ora E. Percus and Jerome K.
Percus.
The Mathematical Intelligencer Volume 32, Number 4, 49-52, DOI:
10.1007/s00283-010-9174-3
What Counts
as an Education Revolution? Phi Delta Kappan, Dec2010, Vol.
92 Issue 4, p101-102, 2p
Prior
achievement, effort, and mathematics attitude as predictors of current
achievement. By Hemmings, Brian; Kay, Russell. Australian Educational
Researcher, Aug 2010, Vol. 37 Issue 2, p41-58.
What's
average? By: Stack, Watson, Hindley, Samson and Devlin. Australian
Mathematics Teacher, Aug2010, Vol. 66 Issue 3, p7-15.
Improving literacy and numeracy in the workplace.
By: Wilson, Tom. Literacy Today, Jun2010, Issue 63, p13-13.
The fear of all sums. Economist, 5/15/2010, Vol.
395 # 8682, p84-84,
“What's Math Got to Do With It?”: Numeracy & Social
Studies Education. By: Crowe, Alicia R.. Social Studies,
Apr2010, Vol. 101 Issue 3, p105-110.
Adult Literacy and Numeracy. Literacy Today,
Mar2010, Issue 62, p20. |
Journal
Articles: Numeracy+Health
Numeracy in
Nursing and Healthcare: Calculations and Practice. By Carlisle, Susan.
Emergency Nurse, Nov2010, Vol. 18 Issue 7, p9-9, 1/6p,
Reviews.
Numeracy in Nursing and Healthcare. By Carlisle, Susan. Nursing
Standard, 10/6/2010, Vol. 25 Issue 5, p30-30.
Neurocognition, Health-Related Reading Literacy,
and Numeracy in Medication Management for HIV Infection. By
Waldrop-Valverde, Jones, Gould, Kuma and Ownby. AIDS Patient Care &
STDs, Aug2010, Vol. 24 Issue 8, p477-484.
Can This Patient Read and Understand Written Health
Information? By: Powers, Benjamin J.; Trinh, Jane V.; Bosworth, Hayden
B.. JAMA: Journal of the American Medical Association, 7/7/2010,
Vol. 304 Issue 1, p76-84
Numeracy and patient safety: the need for regular staff
assessment. By: Warburton, Paul. Nursing Standard, 3/10/2010,
Vol. 24 Issue 27, p42-44.
Boost literacy and numeracy skills in only 25 minutes.
Nursing Standard, 2/3/2010, Vol. 24 Issue 22, p10-10
An evaluation of an online numeracy assessment tool.
By: Warburton, Paul; Sherrington, Sam; Kirton, Jennifer; Ryland, Ida;
Jinks, Annette. Nursing Standard, 3/31/2010, Vol. 24 Issue 30,
p62-68.
|
|
Journal Articles: Statistical Literacy
Write-Skewed: Writing in An Introductory Statistics Course. by Delcham,
Hendrick and Renan Sezer in Education, Summer2010, V130 #4, p603-615.
Statistics and the Modern Student by Robert Gould (2010) in
International Statistical Review, 78,2,297-315. |
“What's Math Got to Do With It?”: Numeracy and
Social Studies Education. By: Crowe, Alicia R.. Social Studies,
Apr2010, Vol. 101 Issue 3, p105-110, 6p; DOI: 10.1080/00377990903493846
|
|
Journal Articles: Data Analysis
High
School Mathematics Teacher Professional Development in Data Analysis,
Probability, and Statistics by Gregory D. Foley, Jeremy F. Strayer,
Blake Regan |
After-dinner talk on intro stats curriculum by Daniel Kaplan (Macalester
College). Takes 2 minutes to load after Open; be
patient. For Save, download
audio with PPT
1up slides into same folder.
Audio stops just before the close. 6up [Ed. 55 min.]
|
|
|
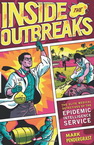 Inside
the OutBreaks Inside
the OutBreaks
Inside the Outbreaks: The Elite Medical Detectives of the
Epidemic Intelligence Service by M.
Pendergrast. Educates people on the importance of epidemiology and
the need to fund it properly. It will come as no surprise to
anyone that public health has always been (and still is) very poorly
funded, even though a good public health approach.. ultimately saves
millions of dollars as well as lives. |
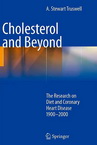 Cholesterol
and Beyond Cholesterol
and Beyond
Cholesterol and Beyond: The Research on Diet and Coronary
Heart Disease 1900-2000 by A. Stewart Truswell.
"With consummate scholarship, clarity and brevity, Truswell sifts out
the chaff and identifies the critical questions, the responsible
investigators, and the key studies." Foreward. "a remarkable
concise book on the history of research on diet and heart disease." |
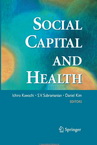 Social
Capital and Health Social
Capital and Health
Social Capital and Health
edited by Ichiro Kawachi, S.V. Subramanian and Daniel Kim. Two
large sections: the first on the measurement of social capital and the
second on the evidence linking social capital to health. Theory of
social capital, the strengths and limitations of current methodologies
of measuring it, and salient examples of social capital concepts
informing public health practice. |
 Fact-Checking Epi Arguments Fact-Checking Epi Arguments
The Spirit Level Delusion: Fact-checking the Left's new
theory of everything by Christopher Snowdon.
Several books (c.f., The Spirit Level, Happiness and Affluenza) have
called for a shift in power to the state based on the supposedly
devastating effects of wealth, economic growth and inequality.
This book argues that the theory lacks empirical support and fails the
test of believability. |
NEW BOOKS: SOCIAL STATISTICS |
|
Presimetrics: What the Facts Tell Us About How the
Presidents Measure Up On the Issues We Care About
by Mike Kimel and Michael E. Kanell. Nigel Holmes (Illustrator)
Fresh look at modern politics by gathering data ... in order to compare
and rank presidential performance on critical issues, from employment
and health care to taxes and family values. The results frequently defy
expectations: |
 Causality:
Methods Matter Causality:
Methods Matter
Methods Matter: Improving Causal Inference in Educational
and Social Science Research by Richard J.
Murnane and John B. Willett. Offers essential guidance for those
who evaluate educational policies. Using numerous examples of
high-quality studies, the authors go beyond the simple presentation of
new analytical methods to discuss the controversies surrounding each. |
 Social
Science Research Social
Science Research
Salsa Dancing into the Social Sciences: Research in an
Age of Info-glut by Kistin Luker. a charming
and effective manual on how to get through the research process with
most of one's enthusiasm still intact. This is a guidebook for the
methodologically bewildered. Endorsing what used to be
called "theories of the middle range," this approach eschews master
narratives and grand theory. |
 Statistical
Persuasion Statistical
Persuasion
Statistical Persuasion: How to Collect, Analyze, and
Present Data...Accurately, Honestly, and Persuasively [Paperback] Dr.
Robert W. Pearson. "This text clearly and straightforwardly
demonstrates how to collect, manage, analyze, and present data in real
world applications in education, criminal justice and other fields in
the social sciences." |
-
Dec.
How to
Win Without Overtly Cheating: The Inverse Simpson Paradox
by Ora E. Percus and Jerome K. Percus in The Mathematical
Intelligencer Volume 32, Number 4 / December 2010.
-
Dec 10-11.
OZCOTS:
Australian Conference on Teaching Statistics to be held
in Fremantle, Western Australia.
-
Nov
Atlantic: Lies, Damned Lies and Medical Science
by David H. Freedman.
Dr. John
Ioannidis (Prof.
of Hygiene and Epidemiology, Medical School, University of
Ioannina ) authored two papers in 2005. In PL0S he proved that
"researchers with come up with the wrong findings most of the time."
His model predicted ... rates of wrongness: 80% for non-randomized
studies, 25% of supposedly gold-standard randomized trials and as
much as 10% of the platinum-standard large randomized trials.
[His 2005 paper in PLoS Medicine, “Why most Published Research
Findings are False,” has been the most-downloaded article in the
history of Public Library of Science.] In his JAMA paper, he
"zoomed in on 49 of the most highly regarded research findings in
medicine over the previous 15 years, as judged by the science
community's two standard measures: the papers had appeared in the
journals most widely cited in research articles, and the 49 articles
themselves were the most widely cited articles in these journals."
"Of the 49 articles, 45 claimed to have uncovered effective
interventions. Thirty-four of these claims had been retested,
and 14 of these or 41 percent, had been convincingly shown to be
wrong or significantly exaggerated. If between a third and a
half of the most acclaimed research in medicine was proven
untrustworthy, the scope and impact of the problem were undeniable."
"How should we choose among these dueling, high-profile nutritional
findings? Ioannidis suggests a simple approach: ignore them
all." "Science is a low-yield endeavor" he says. "I'm
not sure that more than a very small percentage of medical research
is ever likely to lead to a major improvements in clinical outcomes
and quality of life. We should be very comfortable with that
fact."
-
Nov 7:
Big Lies, Little Lies. Fake Unemployment Data. Rising Poverty in
America by Paul Craig Roberts.
"can we trust the government’s statement last Friday that the US
economy gained 151,000 payroll jobs during October? Apparently
not. After examining the government’s report, statistician John
Williams (shadowstats.com) reported that the jobs were “phantom
jobs” created by “concurrent seasonal factor adjustments.” In other
words, the 151,000 jobs cannot be found in the unadjusted underlying
data. The jobs were the product of seasonal adjustments concocted by
the BLS."-
Nov 6:
Katherine Wallman on Statistics and Statistical Literacy.
Science News. "I personally believe that with the advent of computer
technology, people have a lot more numbers readily at their
disposal. They have a lot of computer literacy, but they don’t
necessarily have statistical literacy to go with it. So they can
manipulate lots of numbers but they may not be doing it in the best
advised fashion. I do have a concern personally about the gap
between the availability of information and the computer literacy of
our population and the statistical literacy they should have if
they’re going to use these numbers most intelligently."
Katherine Wallman, US Chief Statistician.
-
Nov 5:
Assessment of Liberal Education, Quantitative Literacy, and
Individual Majors: Lessons Learned, Initial Data & Ongoing Issues
The presenters will discuss assessment
across several academic areas, with a focus on the Liberal Education
program and Quantitative Literacy initiative. The presentation will
include how the assessment tools were developed and implemented,
initial results, and how they are using these results to improve the
curricula. This presentation works as a “How To (or How Not To)”
session. This presentation will be targeted toward assessment
beginners, both faculty and administrators. However assessment
veterans are welcome, especially for their insight during the
discussion at the end of the formal presentation. Presenters: Cheryl
Coolidge, Professor; Beth Crockford, Academic Dean & Professor;
Semra-Kilic Bahi, Associate Professor. Colby-Sawyer College.
See also
Quantitative Literacy: Does it Work? Evaluation of Student Outcomes
at Colby-Sawyer College in Numeracy.-
Oct 29:
Wired Names the Neoliberal Arts—And They Look a Lot Like AAC&U’s
Essential Learning Outcomes
by Debra Humphries. "The
article’s authors present mini -course descriptions on such things
as statistical literacy—making sense of today’s data-driven
world..." "AAC&U, too, has recommended ... in a world of
daunting complexity, all students need practice in integrating and
applying their learning to challenging questions and real-world
problems." "What Wired recommends are exactly the kinds of
things that AAC&U has also recommended—learning experiences that
prepare students to solve unscripted problems and to understand
knowledge in the context of how today’s complex world actually
works." -
Oct 27:
Malta’s
Statistical Institution within a Historical Perspective
by Michael Pace Ross, Director General NSO. "The set of basic
statistical skills (and scepticism) that people need to deal with
information in their everyday lives properly is referred to as
statistical literacy."-
Oct 25:
How Much Math Do We Really Need?
by G. V. Ramathan in the Washington Post.
"How much math do you really need in everyday life? Ask yourself
that -- and also the next 10 people you meet, say, your plumber,
your lawyer, your grocer, your mechanic, your physician or even a
math teacher. Unlike literature, history, politics and music, math
has little relevance to everyday life. That courses such as
"Quantitative Reasoning" improve critical thinking is an
unsubstantiated myth. All the mathematics one needs in real life can
be learned in early years without much fuss. Most adults have no
contact with math at work, nor do they curl up with an algebra book
for relaxation."-
Oct 20:
RSS Series A Read
Paper:
Towards More
Accessible Conceptions of Statistical Inference
by Chris Wild, Maxine Pfannkuch and Matt Regan University of
Auckland, New Zealand and by Nicholas Horton, Smith College, USA.
Abstract: "There is a compelling case, based on research in
statistics education, for first courses in statistical inference to
be underpinned by a staged development path. Preferably over a
number of years, students should begin working with precursor forms
of statistical inference, much earlier than they now do. A side
benefit is giving younger students more straightforward and more
satisfying ways of answering interesting real world questions.
We discuss the issues that are involved in formulating precursor
versions of inference and then present some specific and highly
visual proposals. These build on novel ways of experiencing
sampling variation and have intuitive connections to the standard
formal methods of making inferences in first university courses in
statistics. Our proposal uses visual comparisons to enable the
inferential step to be made without taking the eyes off relevant
graphs of the data. This allows the time and conceptual
distances between questions, data and conclusions to be minimized,
so that the most critical linkages can be made. Our approach was
devised for use in high schools but is also relevant to adult
education and some introductory tertiary courses."
Commentary: Professor Neville Davies from the Society says that
the paper is set to transform the international landscape of
statistical education. "Make no mistake, in my view this read paper
is a seminal event in the society's long history. It is
ground-breaking in its innovation and should have impact and
influence for a long time to come." -
Oct 20:
First World
Statistics Day 20.10.2010
Resolution.
Sponsored by the United Nations.
-
Oct 14:
Quantitative Literacy
across the Curriculum: Integrating Skills from English Composition,
Mathematics, and the Substantive Disciplines by Jane Miller. The
Educational Forum, 74:
334–46, 2010. "QUANTITATIVE LITERACY ACROSS THE CURRICULUM
Despite repeated documentation of innumeracy in the general
population, quantitative literacy is a neglected skill in most
curricula. Resolving this problem involves contributions by faculty
in each of the major academic departments. Figure 1 ... illustrates
how English composition, mathematics, and substantive disciplines
such as science and history intersect to generate quantitative
literacy, each contributing unique and important concepts and
skills." -
Oct 8-10: PKAL/Carleton College
"Quantifying
Quantitative Reasoning in Undergraduate Education: Alternative
Strategies for the Assessment of Quantitative Reasoning"
Program development workshop October 8-10,
2010, Northfield, MN.
The AAC&U's Liberal
Education and America's Promise (LEAP) initiative identifies
quantitative reasoning (QR) among 11 critical learning outcomes for
all students in the 21st century. Sharing this perspective, many
institutions have recently adopted QR graduation requirements. Led
by leaders in the national QR movement, this interactive workshop
will lead campus teams in developing plans to enhance QR programming
and assessment. Friday: 3:40-5:00 Plenary Session: "Quantitative
Reasoning On Campus and Beyond" "Quantitative Reasoning Today" Milo
Schield (Augsburg College) 6up. "Quantitative Reasoning: Some
Evidence and Questions on Learning" Shannon Dingman and Bernie
Madison (University of Arkansas. 6:30-8:15 Dinner Plenary
Session: "Many Women Work, Wealthy People Have More Money, and Other
Important Things I've Learned from Reading Student Papers" Nathan
Grawe (Carleton College). Saturday: Statistical
Literacy at Augsburg, Schield
6up. Teaching
Statistical Literacy as Quantitative Rhetoric, Schmit
4up. 11:45-1:00 Lunch
Plenary Session: "Challenges of QR Assessment" Donna Sundre (James
Madison University). Sunday 11:30-12:00 Lunch and Plenary Session:
"Building a QR Community: The Future of the National Numeracy
Network" Corrine Taylor (Wellesley College) and Len Vacher (Univ.
of Southern Florida).
Agenda-
Oct 5.
Erosion of American higher education
by Bill Costello,
American Thinker. "
Most college graduates are below proficiency
in verbal and quantitative literacy according to the
National Center for
Education Statistics.
QL-Proficient Rates by
Level of Education -
Oct 3:
ASA
Urges Support of Statistical Literacy Bill
The American Statistical Association urges
members of the House of Representatives to support H.R. 6355 , the
Statistical Teaching, Aptitude and Training Act of 2010 (STAT Act of
2010), which was introduced yesterday by Congressman Dave Loebsack
(D-Iowa)and to sign on as co-sponsors. ASA also is urging its
members, as well as all statisticians and mathematicians, to contact
their Congressional representatives about supporting this critical
bill, which is designed to ensure that this and future generations
of students will have the statistical skills to cope in an
increasingly data-centric world.
Statistical
Literacy flyer: "Statistical literacy— the understanding and
using the basic language and tools of statistics, recognizing and
being able to interpret different representations of data in a
context, and knowing how to ask critical questions about the design
and conclusions of a study — is a vital component of mathematics
education. It includes the understanding and interpretation of data
and graphs, including the ability to make rational decisions in the
face of uncertainty. Quantitative literacy includes statistical
literacy, but also addresses understanding mathematical relations
(e.g., investment income growth) and number sense (e.g., What is the
per capita share of a $700 billion bailout debt spread among 300
million citizens?)."
Bill summary
Bill tracker-
Oct 1: To mark the launch of the Royal
Statistical Society (RSS) ten-year statistical literacy campaign,
the Royal Statistical Society
Centre for Statistical Education (RSSCSE) and the University of
Plymouth are pleased to host a series of free statistical education
days and workshops from 20 - 26 October. These not to be missed
events will include a number of presentations by leading
international experts, presenting ground-breaking aspects of
statistics teaching and learning.
-
Oct 1: "no idea has stifled the growth
of statistical literacy as much as the endless repetition of the
words correlation is not causation. This
phrase seems to be primarily used to suppress intellectual inquiry
by encouraging the unspoken assumption that correlational knowledge
is somehow an inferior form of knowledge."
Three-Quarter Truths: Correlation Is Not Causation by John Myles
White.-
Oct 1:
Statistical Literacy
is #1 course to fill gaps in college education.
October issue,
Wired Magazine. "Our
world is shaped by widespread statistical illiteracy. We fear
things that probably won't kill us (terrorist attacks) while
ignoring things that probably will (texting while driving)."
Jim Rodgers: "Statistical Literacy: You may be in the Disraeli
camp regarding statistics, but you certainly should be able to
recognize how a statistic is gathered and presented."
"Unfortunately, most math instructors avoid statistics and most
statistics instructors make the material seem absolutely painful." -
Sept 27: Law of Very Large Numbers
"The unlikely is almost certain given enough tries"
Schield Excel demo. -
Sept 24:
How subtle factors in poll construction help determine polling
results. Carl Bialik,
The Numbers Guy WSJ -
Sept 20:
ACT: Mind the Gaps: How College Readiness Narrows Achievement
Gaps in College Success" is the latest
report to bring attention to the critical relationship between
college readiness and college success. Chance of at least a B for
students completing core curriculum vs. same chance for those with
less: Intermediate Algebra (39% vs. 32%), College Algebra (43%
vs. 35%), Pre-calc/Finite (41% vs. 37%). (The high-level report aims to
shed light on the importance of better college preparation in high
schools and the lasting impact it bears on a student’s success in
college. "In 2009, 67 percent of ACT-tested high school graduates
were ready for first-year college coursework in English Composition,
42 percent were ready for College Algebra, 53 percent were ready for
social sciences coursework (i.e., History, Psychology, Sociology,
Political Science, and Economics) and 28 percent were ready for
Biology (Figure 7). Just 23 percent were ready for college work in
all four subject areas (ACT, 2009b)."
Executive Summary
Full Report. See how racial and income gaps for college
enrollment, first year high grades and re-enrollment vary with
college readiness and math courses taken. Fig
10,
12,
13,
17,
18,
25,
26,
27,
28,
30,
31.
Achieve:
Minding the (Expectations) Gap.-
Sept 19:
Marilyn Savant's Four Envelope Problem.
Schield Excel demo of the
solution. -
Sep 10: Poynter Report,
The New Media Landscape
by Doug Bradshaw:
"...journalists’ training will have to change. The profession has a
history of arts graduates who are highly literate but not typically
numerate. That has already been the source of ongoing embarrassment
for the profession." "There is a danger of ‘data churnalism’ –
taking public statistics and visualising them in a spectacular way
that lacks insight or context. Editors will need the statistical
literacy to guard against this, or they will be found out."-
Sept 7: Hahn-Doganaksoy,
Numbers in Everyday Life: A Short Course
for Adults,
voted #1 at JSM.
6up-
Sept 3:
The Flu: It's about Variance Rebecca Goldin.
" the notion of average is
itself misleading" because "the variance is so high."
"If
you averaged the highs and lows of a rollercoaster, it wouldn’t be
much of a thrill ride; same with the threat of flu."
-
Aug 28:
Understanding Ag Statistics:
NASS and FFA.
"USDA's National Agricultural
Statistics Service and the National FFA Organization have developed
a new series of K- 12 online learning tools and outreach kits to
increase statistical literacy in the classroom through the
exploration and use of data from the 2007 Census of Agriculture. To
access the materials for free, visit the
FFA Learn web site."
Lesson Plans-
Aug 10: Achieving the Possible
86% of voters support “college- and
career-ready” graduation requirements for all high school students.
"Raising academic and graduation requirements means more students
will drop out of high school."
57% of those with less than
college education agree; 54% of
those in states with CCR Graduation Requirements agree. Overall 49%
agree (50% disagree).
Poll Release
6up
-
Aug 5-7:
MathFest 2010
Pittsburg, PA.
Quantitative Reasoning/Literacy: The Role of
Quantitative and Covariational Reasoning in Trigonometry Curriculum
by Kevin Moore; Quantitative Reasoning by Darcel Strayer;
Current Events Friday by
Kira Hamman 6up. Minicourse: A Game Theory Path to
Quantitative Literacy by David Housman and Rick Gillman.
Statistical literacy: Popular Media and Introductory Statistics
by Karen Briggs 6up. Analyzing Real Biomedical Data Using
Scientific Writing and TI Calculators by
Magdalena Luca.
SIGMAA QL Panel Discussion: Mathematics in Interdisciplinary
Survey Courses. Organizers: Cinnamon Hillyard and
Stuart Boersma. Panelists: Maura Mast, Mike
Pinter, Robert Root, Natasha Dobrinen and Susan Goldstine. Others:
Benford's Law, a Growth Industry by Kenneth Ross.
Zipf's Distribution in "Gadsby" by Ze Cheng.
An Examination of Student Attitudes in a Business Statistics Course
by Deborah Gougeon.
Abstracts -
August:
Statistics
for All — the Flip Side of Quantitative Reasoning by
J.
Michael Shaughnessy, NCTM President.
"Over the years ... I’ve been increasingly impressed by how
important statistical literacy has become for all of us around the
globe. And statistics will only continue to become more critical in
the future. Statistical literacy has risen to the top of my advocacy
list, right alongside numeracy, and perhaps even ahead of “algebra
for all.” By statistical literacy, I mean much more than just the
ability to read graphs or compute means as representatives for data
sets. I mean developing the ability to reason in the presence of, or
under conditions of uncertainty. It may be that the most important
quantitative reasoning ability of all is the facility to read and
interpret statistical information and make informed inferences based
on statistical and probabilistic information." "Mathematical
arguments are based on proof and certainty. There is beauty—and
perhaps even comfort—in convincing mathematical arguments such as
the proof that demonstrates that the amazing Pythagorean
relationship holds among the sides of every right triangle, or that
for any circle the ratio of the circumference to the diameter is
equal to the same number, every time, no matter the size of the
circle. This is beautiful stuff, and we clearly want all our
students to understand and to bask in these elegant mathematical
truths. However, unlike the reasoning behind this mathematics,
statistical reasoning and sense making, by their very nature, occur
under conditions of uncertainty. The twin sister of the “certainty”
in mathematics is the “uncertainty” in statistics. We must prepare
our students to deal with both types of quantitative reasoning as
they grow in the mathematical sciences."-
July 31 - Aug 5.
Joint
Statistical Meeting of the American Statistical Association
(Vancouver, BC).
Program
Sunday Topics in causal inference: Design of an Observational Study ...
by Donald Rubin, Stephanie
Schrag and Elizabeth Zel.
Monday Session Statistical Literacy 2010:
Numbers in Everyday Life: A Short Course
for Adults by Gerald Hahn, Necip
Doganaksoy, Ricki Lewis, Jane Oppenlander and Josef Schmee
6up;
Statistical Literacy and Time-series Information by Anders
and Britt Wallgren 6up;
The Undetectable Difference: An Experimental Look at the
“Problem” of p-Values by Bill Goodman
6up;
Probability in Decline
by Dean Brooks 6up; and
Teaching Statistical Literacy as a
Quantitative Rhetoric Course by John Schmit
6up.
Monday
Learning to Fly without a Net: Inferring
Legal Causation by Herbert Weisberg. Roundtable: Readings for Intro Stat Courses Organizer Veda Abu-Bakare.
Rethinking Statistics Courses - What to Let Go of? Panel:
Deborah Rumsey, Allan Rossman, Beth Chance, Jessica Utts
Tuesday Framing Specific Hypotheses: What's the
Alternative? by Daniel Kaplan.
Interpreting Variability in Various Types of Graphs: How do
Teachers' Recognize/Understand Variability?
Linda Cooper. Roundtable Statistical Literacy as a Separate Course from Introductory
Statistics by Robert Molnar.
Wednesday The Role of
Statistics in Science and Everyday Life: A First Year Seminar by
Jessica Chapman 1up.
Moving towards a QL core competency requirement by A. John
Bailer 6up. Assessment of QR Across a General
Education Curriculum by Stephanie Cano, Nandini Kannan and
Ermine Orta 1up.
The Social Construction of Rankings
by Milo Schield. 6up Session: Understanding
Students' Attitudes.
The Hidden Attitude: Students' Perceptions of "Statistics" Prior
to Taking the First Course by Marjorie Bond and Gloria Lehr
6up.
Assessing Changes in Students' Attitudes: the good, the bad, and
the ugly by Anne Millar and Candace Schau. Session
(509). Adjusting for Treatment Disparities in Observational
Research by Marshall Joffe. Roundtable: The Basics of the Survey of Attitudes Toward Statistics
Sponsor: Section on Statistical Education: Candace Schau. -
July
Join the ASA Statistical Literacy Grassroots Campaign:
"The American Statistical Association requests your participation in
our statistical literacy grassroots campaign.
With preparation underway for the reauthorization of the
Elementary and Secondary Education Act (No Child Left Behind), this
is a wonderful opportunity to educate our elected leaders about
statistical literacy, its benefits and the challenges toward
achieving it."
"If you
are going to be at JSM, you are also invited to be part of a
training session at 5 pm on Wednesday, August 4 in Convention Centre
Meeting Room 9 (CC-9)." "We recognize that statistical literacy
is a vital component of mathematics education."
Resources: (1) "For
Today's Graduate, Just One Word: Statistics," New York Times,
August 5, 2009, front page. (2)
Promoting
Statistical Literacy one-pager.
-
July
International Conference
on Teaching Statistics (ICOTS-8 Ljubljana, Slovenia).
Keynote
videos.
Plenary 1 Hans Rosling
-
What showbiz has to do
with it. Check out Gapminder. See a
video of Hans in action.
Plenary 2 Jessica Utts -
The strength of evidence
versus the power of belief: Are we all Bayesians.
Plenary 3 Gerd Gigerenzer
- Helping doctors
and patients make sense of health statistics: towards an
evidence-based society
Session 1G Ograjenšek - Lies, damn lies, statistics:
1G1 The compleat applied
statistician: Donald Bentley (US).
1G2
Unintentional lies in the
media: don’t blame journalists for what we don’t teach: Jessica
Utts (US).
Session 4D Forester - Innovations in Teaching Statistics:
4D1 Real-Life Module
Statistics Xiao-Li Meng (US).
4D3
Enriching Statistics
courses with Statistical Diversions Eric Sowey and Peter
Petrocz (Australia)
Session 5E Utts - Assessing
statistical literacy:
5E1
Assessing the
interpretation of two-way tables as part of statistical literacy:
Jane Watson, Erica Nathan (Australia).
5E3
Post secondary and adult
statistical literacy: assessing beyond the classroom: Jennifer
Kaplan (US)
Session 7A Murphy - Statistics and the media:
7A1 Association-Causation Problems in
News Stories: Milo Schield
(US) 6up.
7A2
Spinning
heads and spinning news: the American media’s gap in quantitative
reasoning skills: Rebecca Goldin (US).
7A3
Statistics on national
radio: some insights from working with professional broadcasters:
Kevin McConway (UK).
Session 7G Schield - Statistics
for non-quantitative majors:
7G1
Using media reports to
promote statistical literacy for non-quantitative majors
by
Stephanie Budgett, Maxine Pfannkuch (NZ).
7G2
Luring non-quantitative
majors into advanced statistical reasoning (and luring statistics
educators into real statistics): Nicholson et al.
7G3
Using a Five Step
Framework for interpreting tables and graphs in their contexts:
Marian Kemp and Barry Kissane (Australia).
7G4
How we can all learn to
think critically about data: Ian Gordon, Sue Finch (Australia).
9A3 People Reasoning with
Information and Mis-Information Jim Ridgway et al. (UK)
5D1
Statistics assessment
the good, the bad, and the ugly James Nicholson et al.
(UK)
8J4: Understanding, teaching
and using p values Geoff Cumming (Australia)
Special Interest
Group: Critical Numeracy --
Statistical literacy:
Critical Numeracy by Jane Watson (AU)
Statistical Literacy 2010: An
Update by Milo Schield
(US).
ISLP International Statistical Literacy Project.
7H2 Improving
Statistical Literacy by National and International Cooperation Helenius (Finland)
Contributed Papers:
C101
Dichotomous
thinking: a problem beyond NHST: Jerry Lai (AU).
C104
Identifying
misconceptions about confidence intervals: Pawel Kalinowski
(Australia).
C143
The
confidence intervals: a difficult matter, even for experts:
Gabriel Yáñez Canal (Colombia).
C153
Developmental changes in Australian school students’ interest for
statistical literacy: Colin Carmichael and Ian Hay (Australia).
C156 The American
Psychological Association Publication Manual sixth edition:
implications for statistics education: Fiona Fidler (Australia).
C158 Teachers’
perceptions of best practice in statistical literacy education:
Ian Hay (Australia).
C159
Aspects of
statistical literacy ...: empirical research in the project “RIKO-STAT”:
Kuntze, Engel, Martignon andn Gundlach (Germany).
C165
Creating YouTube videos that engage students and enhance learning in
statistics and Excel Nicola Petty (NZ)
C166
Interpreting
literacy and numeracy testing reports: what do teachers need to
know? Robyn Pierce and Helen Chick (Australia).
C193
Teaching
strategies to promote statistical literacy: review and
implementation: Svetlana Tishkovskaya (UK).
C202 Hidden jargon:
everyday words with meanings specific to statistics
Christine Anderson-Cook (US).
C206
Enhancing
statistical literacy through short open-ended questions that involve
context, data, & upper level thinking: Esfandiari et al
C258
Ethical-political
aspects of statistical literacy: Karen François (Belgium).
C265 Is median an easy
concept? Semiotic analysis of an open-ended task Silvia Mayén
(Mexico) and Carmen Díaz (Spain).
-
June. 2010-11 ISLP Statistical Literacy Poster Competition.
Form and Phases.
ISLP Personnel: Executive, Advisory Board and Country representatives.
ICOTS
(July 12): ISLP open-meeting agenda-
June. AACU includes "Quantitative
Literacy" and "Information Literacy" in 12 "Essential
Learning Outcomes".
-
June. U. of Edinburgh PhD Studentship
Re-defining statistical literacy in teaching statistics to
undergraduate medical students.
-
May 15.
Assessment Methods in Statistical
Education: An International
Comparison.
Wiley (pb, $82).
Edited by P. Bidgood, N. Hunt and F.
Jolliffe. Part B on Assessing Statistical Literacy includes Ch
6: Assessing statistical thinking by Jolliffe; Ch 7: Assessing important learning outcomes in introductory tertiary
statistics courses by Garfield, delMas and Zieffler; Ch 9. Assessing students’ statistical literacy by Budgett and
Pfannkuch; Ch 11 Assessing statistical literacy: Take CARE
by Schield:
Excerpts.-
May
Letters from ASA Presidents to NC Senators asking for their help to
promote statistical literacy
"Statistical literacy ... is important
because of our society’s growing dependence on data and the
accompanying importance of reasoning under uncertainty. Media
sources confront us with statistical information on topics such as
the economy, education, food, medicine, climate change, security,
public opinion, entertainment, and social behavior. Statistical
literacy skills—including data analysis strategies, critical
thinking, and other related concepts— help guide our decisions and
enable us to meet our responsibilities as citizens." "We would
welcome a discussion with you or your staff about how we can work
together to promote statistical literacy... Excellence in
mathematics education that includes statistical literacy is vital to
our nation’s economic prosperity, global competitiveness, and
homeland security in the 21st century." Signed by four ASA
Presidents: James O. Berger, Alan F. Karr, Sally C. Morton, and
Sastry G. Pantula .
Attached document:
Statistical Literacy in PreK-12 Education.
-
April 25:
Chances
Are by Steven Strogatz, NY Times
Opinionator. "Perhaps the most pulse-quickening
topic of all is “conditional probability” — the probability that
some event A happens, given (or “conditional” upon) the occurrence
of some other event B. It’s a slippery concept, easily conflated
with the probability of B given A. They’re not the same, but you
have to concentrate to see why."-
April 19:
Clive Thompson on Why We Should Learn the Language of Data.
"Statistics is the new grammar."-
April:
Modeling
Quantitative Literacy by Jesse L. M.
Wilkins Virginia Polytechnic Institute and State University. "In
this study, exploratory factor analysis and confirmatory factor
analysis were used to build and evaluate a measurement model of
quantitative literacy. Data from the Second International
Mathematics Study (SIMS) were used to create calibration (N = 1,429)
and validation samples (N = 1,429) of high school students for
testing an initial model and cross-validation. An additional sample
of high school students (N = 1,429) collected from the midwestern
part of the United States was used in a replication study. In each
stage, a hierarchical three-factor model was compared with two
alternative rival models: a one-factor model and a hierarchical
two-factor model. The results of the analyses supported the
structure of the hierarchical three-factor model. Implications and
limitations associated with the findings from the study are
discussed."-
April: New data visualization tool from Tableau Public at
www.tableausoftware.com.
Not only does it facilitate the display of any
user's data, it allows one to see the relationship between two
variables in a geographic layout. See the US Under-Funded Public
Pension map by state where the size of the circle indicates the
amount under-funded and the color indicates the under-funding rate:
www.tableausoftware.com/public/gallery/mish-pension-viz
-
March:
Odds Are, It's Wrong: Science fails to face the shortcomings of
statistics by Tom Sigfried in
Science News.
-
March 10:
Draft K-12 Common Core State
Standards Available for Comment.
The Common Core State Standards [for
English and Mathematics] provide a consistent, clear understanding
of what students are expected to learn, so teachers and parents know
what they need to do to help them. The standards are designed to be
robust and relevant to the real world, reflecting the knowledge and
skills that our young people need for success in college and
careers.
Downloads.
Teams. The mathematics work team included Bernard Madison,
Deborah Hughes Hallett and Richard Scheaffer. The mathematics
feedback group included Hyman Bass and Roxy Peck.-
March:
Delving Deeper: Sizing Up Class Size: A Deeper Classroom
Investigation of Central Tendency
By Larry Lesser -- published in
The Mathematics
Teacher. An investigation of average class size
introduces the difference between mean- per-class and
mean-per-student. Learn about self-weighted means and the inspection
paradox. Dec. 2009, Vol 103, Issue 5, Page 376.
-
Feb 5:
Confounded -- a poem by Larry Lesser -- published in
The Mathematical Intelligencer by Springer.
According to Larry, "the 'Peterson roll' is a common way a
wrestler scores a 'reversal' to go from bottom to top in one move."-
Jan 31: LA Times Opinion on the need for Quantitative Literacy:
But Who's Counting? by Doug
Smith. Quotes from Lynn Steen and Milo Schield.
-
Jan 13-16. MAA-AMS Joint Mathematics Meeting, San Francisco.
SIGMAA-QL 2009 Survey:
Quantitative
Graduation Requirements at US Four-Year Colleges by Milo Schield
6up
An
Across-The-Curriculum Approach to Quantitative Literacy in
Environmental Studies, Ben Steele et al. Colby-Sawyer College.
6up
Modeling Radon in Pennsylvania by Mike Huber, Muhlenberg
College 6up -
Jan 8: Common Standards and New
Assessments for K12:
Recommendations from the National Forum convened by the Conference
Board of the Mathematical Sciences.
Comment: "a widespread reaction to the draft standards was that the
standard for mathematical practice is extremely ambitious, but the
content described by the ten content standards would be
insufficient for a student entering college with the intent to
major in STEM." Recommendations: "Be explicit that students
intending to major in STEM will need mathematical content beyond
that described in the standards. Include more statistics and
emphasis on quantitative literacy." "Make use of available
research in creating the standards."
|
|
Our Top Statistical Literacy Books as of 2010 |
|
Popular books
Choice based solely on the opinion of the StatLit webmaster
Rank, Author, (Date) and Title
[Ordered somewhat by date]
-
Lynn Steen (2001),
Mathematics and
Democracy: The Case for Q/L
-
Joel Best (2002),
Damned Lies and Statistics-
Joel Best (2004),
More Damned Lies and
Statistics -
Darrell Huff (1954), How To Lie
with Statistics
-
Edward Tufte (1983),
The Visual
Display of Quantitative Information
2nd ed. -
Lynn Steen, Ed (1990), On The Shoulder’s Of Giants: New
Approaches to Numeracy
-
Lynn Steen (1997)
Why Numbers Count:
Q/L for Tomorrow’s America -
John Paulos (1988),
Innumeracy:
Mathematical Illiteracy
-
John
Allen Paulos (1993), once upon a number: hidden
mathematical logic of stories
-
Edward Tufte (1995),
Visual
Explanations
-
Howard Wainer (2000),
Visual
Revelations
-
Robyn Dawes (2001),
Everyday
Irrationality
-
Murray,
Schwartz & Lichter (2001). How
Media Make & Unmake ... Reality. -
Howard Wainer (2005),
Graphic Discovery: A Trout in the Milk
-
Gerd Gigerenzer (2002),
Calculated Risks: Numbers Deceive You -
Lynn Arthur Steen (2004),
Achieving
Quantitative Literacy |
Broad Academic
books (excluding textbooks)
Choice based solely on the opinion of the StatLit webmaster:
Rank, Author, (Date) and Title
[Ordered somewhat by date]
-
Hans Zeisel (1947), Say It With
Figures-
Stanley Lieberson (1985),
Making
It Count -
Victor Cohn (1989), News and
Numbers
-
Stephen K. Campbell
(1974), Flaws and Fallacies in Statistical Thinking
-
Phillip Meyer (1991),
The New Precision Journalism
-
A. K. Dewdney (1995), 200% of
Nothing
-
John Allen Paulos (1995),
A
Mathematician Reads the Newspaper
-
John Brignell (2000),
Sorry, Wrong
Number
-
Jane Miller (2004), The Chicago
Guide to Writing About Numbers -
Sarah Cohen (2001), Numbers in the Newsroom: Math and
Statistics in the News
-
John Brignell (2004),
The
Epidemiologists
- Jane Miller (2005),
The Chicago
Guide to Writing About Multivariate Analysis
-
Michael Blastland (): The Tiger
That Isn't-
Kaiser Fung
():
Numbers
Rule Your World
-
Richard Gillman (2006),
Current Practices in Quantitative Literacy -
Roxy Peck et al., (2009),
Making Sense of Statistical Studies
|
|
OTHER TOP BOOKS (as of
Dec 2010) |
|
Narrower Academic Books (Excluding
Textbooks)
Selected by the StatLit Webmaster
Rank Author and Title
-
Nassem Taleb: Fooled by
Randomness: The Hidden Role of Chance -
Hubbard" How to Measure
Anything: Valuing Intangibles in Business
-
Edward Tufte:
Envisioning Information
-
Stephen Few: Now You See It:
Simple Visualization Techniques
-
Othmar Winkler (2009),
Interpreting Economic and Social Data
-
Herbert
Weisberg (2010).
Bias and Causation
-
Jane M. Watson (2006),
Statistical Literacy at School
-
Gerald Bracey (2006),
Reading Educational Research -
Doll (2011).
Assessment Methods in Statistical Education,
Wiley
-
Donna Wong ():
WSJ Guide to Information Graphics
#2.
Research Design: Qualitative, Quantitative & Mixed Methods Creswell
Murnane+Willett (2099).
Methods Matter: Improving Causal Inference ...
|
Textbooks
Selected by the StatLit Webmaster
Rank Author and Title
-
Utts:
Seeing Through Statistics -
Madison et al.,
QR: A case book of media articles
-
Whitin ():
Learning
to Read the Numbers
-
|
|
AMAZON's TOP
STATISTICS/QR/QL TEXTBOOKS as of 2010 |
|
Ranks based on sales rankings at Amazon.com as of Feb 5, 2011.
These rankings fluctuate daily and don't
include sales made directly by publishers to bookstores.
Rankings via www.salesrankexpress.com
Rank Author and Title
2,064 Triola:
Elementary Statistics
2,370 Salkind:
Statistics for People Who (Think They) Hate Statistics
3,201 Field:
Discovering Statistics Using SPSS
3,984 Gonick and Smith:
Cartoon Guide to Statistics
4,251
Triola:
Essentials of Statistics
4,292 Moore:
The Basic Practice of Statistics 5th
4,611 Gravetter
et al:
Essentials of Statistics
Behavioral Sciences 7th
5,287
Donnelly:
The Complete Idiot's Guide to Statistics 2nd ed.
5,537
Agresti, Franklin:
Statistics:
Art/Science Learning from Data 2nd
6,674 Rumsey:
Statistics for Dummies I
7,653 Moore, McCabe, Craig:
Introduction to the Practice of Statistics
8,165 Bluman:
Elementary Statistics: A Step By Step Approach
10.564 Freedman, Pisani and Purves:
Statistics
11,505 Burger and Starbird:
Heart of Mathematics
13,762
Miller, Heeren and Hornsby:
Mathematical Ideas 11th
16,094
Voelker, Orton and Adams:
Statistics (Cliffs Quick Review)
17,925 Urdan:
Statistics in Plain English
2nd
18,025 Utts:
Seeing Through Statistics
18,768
Sullivan:
Fundamentals of Statistics
3rd
18,891 Brase
& Brase
Understandable Statistics 9th (Understanding Basic)
22,388
Witte and Witte:
Statistics
9th
29,260
Agresti & Finlay:
Statistical Methods for Social Sciences 4th
32,338 COMAP:
For All Practical Purposes: Mathematical Literacy
...
34,180 Moore, McCabe et al
The Practice of Business Statistics 2nd
36,908 Moore and Notz:
Concepts and Controversies 7th
41,477 McClave, Sincich and Mendenhall:
Statistics
11th
|
43,870
Aufmann and Lockwood:
Mathematical Thinking and QR
45,377
Sullivan:
Statistics: Informed Decisions Using Data
2nd
55,067 McClave
and Benson:
Statistics
for Business Economics 11th
59,827 Bennet & Briggs:
Using & Understanding Math: QR Approach
4th
72,400
Johnson:
Statistics: Principles and Methods
6th
82,526 Howell:
Fundamental Statistics for the Behavioral Sciences 7th
103,556
Bennet, Briggs, Triola:
Statistical Reasoning For Everyday Life
3
106,673 Sprinthall:
Basic Statistical Analysis 8th
112,323
Nolan and Heinzen:
Statistics for the Behavioral Sciences 1st
132,308
Hand:
Statistics -- A Very Short Introduction
137,904 Utts and Heckard:
Mind on Statistics 3rd 770p.
138,161
Rossman, Chance:
Workshop Statistics
with Data
138,507 Kiess, Green:
Statistical Concepts for Behavioral Sciences 4th
146,688
Woloshin-Schwartz-Welch
Know Your Chances,Health Statistics
240,913
Pearson:
Statistical Persuasion:..Collect, Analyze, Present Data
379,621 Sevilla and Somers:
QR: Tools for Today's Citizen
1st
434,337
Larson and Farber:
Elementary Statistics: Picturing the World
443,667
Rossman-Chance-Lock:
Workshop Statistics:
Data and Fathom
510,906
Utts and Heckard:
Statistical Ideas and Methods 1st
544,893 Langkamp and Hull:
QR and the Environment
1st
649,806 Rossman, Chance:
Investigating Statistical Concepts ... 1st
882,205 Greenleaf:
Quantitative Reasoning: Understanding Nature
2nd
1,093,508
Fusaro, Kenschaft:
Environmental Math in the Classroom
1st
1,566,752 Sons:
Mathematical Thinking & Quantitative
Reasoning 4th
1,973,077
Madison et al.,
QR: A case book of media articles
2,339,036 Bennett and Briggs:
Themes of the Times on QL 4th
2,400,224 Pierce, Wright, Roland:
Mathematics for Life: ... QL
2,784,024 Abramson and Isom:
Literacy
and Mathematics 1st
3,175,710 Bennett, Briggs:
Essentials of Using and Understanding Math
2
4,175,755 Richman et al:
Mathematics for Liberal Arts
5,091,669 Burkhart: Quantitative and Qualitative Reasoning Skills
|
|
TOP
STATLIT-SITE PAPERS VIEWED IN 2010 |
|
Papers with over 400 views at
www.StatLit.org in 2010.
Total downloads: (207,000 in 2010, 184,000 in 2009; 106,000
in 2008).
Numbers in parenthesis are (2010; 2009; 2008) counts.
2010: The StatLit website hosts 679 pdfs including 158 pdfs of slides.
-
Percentage
Graphs in USA Today. Milo Schield 2006 ASA (10,664; 13253; 14247;
8809). Inception to date:
47,552.
-
The Cult of Statistical
Significance by Stephen Ziliak and Deirdre McCloskey
2009 ASA 6up
4up (3972; 999) -
Importance and Measurement of
Pre-Service Teachers' Efficacy to Teach Statistics...
2009 ASA Harrell et al. (2,506) -
Q/R Textbooks
StatLit Q/R textbook web-page (2234; 1532)
-
Interpreting the substantive significance of multivariate
regression coefficients
by Jane Miller 2008 ASA
(2094; 1412)
-
Presenting Confounding Graphically Using Standardization
(2084; 1985; 1616).
Milo Schield, 2006 Draft for Stats magazine
-
Exploring Simpson's Paradox. Larry Lesser (Univ. Texas, El Paso) NCTM
2001 (2043[11]; 2844; 913)
-
Univ. Texas San Antonio: Quantitative Scholarship - Final Draft
Press Release 2009 (2000[11],
1174) -
Developing
statistical literacy with students and teachers in the secondary
mathematics classroom. PhD Thesis. Doyle (1811[9]) -
The
Components of Numeracy. Ginsburg,
Manly & Schmitt 2006 NCSALL (1809[8]; 466; 235)
-
Some Difficulties Learning
Histograms. Carl Lee & Maria Meletiou-Mavrotheris ASA 2003
(1792; 991; 1179)-
Statistical Literacy
Textbook: Introduction 2009 M Schield (1209[9])
-
Three Paradoxes.
Howard Wainer and Lisa Brown, Nat. Board of Med. Examiners. Draft American Statistician 2004 (1084[10]; 315; 750)
-
Sencer 2009 Statistics
Symposium Program. Metropolitan State U.[1078[5]; 282]
-
Statistical Literacy:
An Online Course
at Capella University. Marc Isaacson (Augsburg College) 2005 ASA
(1054[10]; 902; 1202) -
Quantity Words Without Numbers: Why Students use "Many".
Milo Schield 2005 Carleton (889[6] 1863; 2090)-
Social Mathematics in US Civics
Curriculum. James Mauch
dissertation 2005 (858[7]; 442; 470)
-
Statistical Literacy &
Mathematical Thinking. Milo Schield 2000 ICME (753[7]; 681; 997)
-
Bracey
Principles by Gerald Bracey 2006 (702[6]; 312)
-
Pedagogical Challenges of Quantitative Literacy. Bernie Madison,
President of NNN, 2006 ASA (690[7]; 476; 468)
|
-
Just Plain Data Analysis: Common
Statistical Fallacies.... Gary Klass (Illinois State University)
2008 ASA (654[6]; 991; 499)-
Connections between Experimental and
non-experimental designs by Elizabeth Stuart 2009 ASA
1up (637[6]; 150)
-
Ambiguity
Intolerance: An Impediment to Inferential Reasoning?
Robert Carver 2006 ASA (624[5]; 797)
-
Statistics for Political Science
Majors. Gary Klass 2004 ASA (596[6]; 765; 215)
-
People Count: The Social
Construction of Statistics. Joel Best 2002 Presented at ASA (554[5]; 803; 1,087)
-
Teaching the Social Construction of Statistics
by Milo
Schield, 2007 Midwest Sociological Society (462[5]; 340; 754)
-
Frequency of Simpson's
Paradox in NAEP Data. Jim Terwilliger & Milo Schield, 2004 AERA
(448[3]; 1070; 678)
-
Accuracy and Apparent Accuracy in Medical
Testing by Stuart Boersma and Teri Willlard
6up slides 2009 NNN (421[4]; 781)
Number of months tracked in brackets [#] if less than 12. Excludes papers tracked less than 3 months
or having less than 400 downloads.
New Papers in 2010:
-
How We can All Learn to Think
Critically About Data. 2010 Ian Gordon and Sue Finch, Univ. of
Melbourne. (714[4])
-
A Five Step Framework for
Interpreting Tables and Graphs in Their Contexts. 2010
Marian Kemp & Barry Kissane Murdoch U. (607[5])
-
The Undetectable Difference: An
Experimental Look at the “Problem” of p-Values. ASA
6up 2010 Goodman.
(371[2])
-
Teaching
Statistical Literacy as Quantitative Rhetoric. ASA 2010 John
Schmit 6up (279[2])
-
The Social Construction of Rankings.
ASA 2010 Milo Schield 6up
(194[2])
-
World
Statistics Day Resolution 10/10/10. United Nations
(146[1]) -
Association-Causation Problems in
News Stories. ICOTS 2010 Milo Schield (107[1])
-
The NeoLiberal Arts --
Statistical Literacy. Wired magazine 2010 (102[1]).
-
Quantitative Graduation Requirements at US
Four-Year Colleges. 2010 MAA JMM 6up
by Milo Schield (102[1])
-
Statistical Literacy for Managers
Analyzing Time Series Data. ASA 2010 Anders and Britt Wallgren
Örebro University and Statistics Sweden
6up (100[1])
|
|
TOP
STATLIT-SITE PAGES VIEWED IN 2010 |
Top StatLit Pages Viewed at
www.StatLit.org in 2010
(####; ###; ###): page views in 2010; 2009; 2008.
-
Welcome (23,159; 15,729; 10,423): Home
Page: Current -
Adult Numeracy (5,007; 2,467; 1,987):
News on adult numeracy.
-
StatLit News 2009
(4,869):
Stat-Lit News from 2009.
-
Joel Best
(4,794; 3,481; 3,118): Author "Damned Lies & Statistics"
-
StatLit News 2008 (3,333; 2,634):
Stat-Lit News from 2008.
-
Standardizing (3,265; 2,434; 1,718): Excel
displays standardizing.
-
StatLit Papers
(3,131; 2,837; 2,444): Papers and presentations.
-
Howard Wainer (2,778; 2,127; 1,966):
Author of "A Tout in the Milk".
-
Q/L Textbooks
(2,741; 2,484; 2,387): Q/R or Q/L textbook details.
-
Gerald
Bracey (2,655; 2,669; 2,035): "Reading Educational Research" -
StatLit News 2007 (2,552; 1,498; 1,928): Stat-Lit News
in 2007.-
Q/L Books
(2,074; 1,418; 1,459): Q/L-related books (not texts).
-
Gerd
Gigerenzer (1,993*; 1,415; 1,503):
Author "Calculated Risks"
-
StatLit News 2006 (1,971; 1,386; 1,523):
Stat-Lit News in 2006.
-
John Paulos (1,935; 1,845; 1,669):
Author of "Numeracy".-
StatLit
News 2004
(1,929; 1,191; 1,183: StatLit News from 2004 -
W. M. Keck Statistical Literacy Survey
(1,564*) 2002 Long version
-
Q/L Activities
(1,725*; 1,278; 1,378): Details Q/L-related activities.
|
Note: Website statistics are tabulated by
the DeepMatrix program LiveStats® .XSP V8.03. Each month, the views
for the top 25 website pages are tabulated. Those pages that
aren't in the top 25 that month are treated as having zero views.
Thus the annual totals for the most popular pages (e.g., Home page)
are quite accurate, whereas those with the lowest ranks MAY BE
understated.
* Pages with less than 12 months
statistics are indicated by the asterisk (no adjustment). Pages with
less than 9 months of statistics are omitted (except those that are
student assigned during certain months).
In 2010, the StatLit web site has 47
pages: 34 in the main directory. Others include student-assigned pages (/GC) and the
Keck Survey.
Navigation page views totaled (9,716; 9,522; 8,474): Statistical
Literacy (2,729; 2,396; 2,100), StatLit News
(1,836;
1,928; 1,863), Authors (1,980; 2,033; 1,860), Statistical
Reasoning (1,617*; 1,625; 1,425) and
Numeracy (1,554*; 1,540; 1,226).
Student-assigned page-views
[all via /GC] totaled 7,129 (3,907; 5,548). These included the
grammar-checker programs (SLRSV.aspx; four versions) with 4,097
(1,988; 3,374) views and the
Part-Whole program (PartWholeImages.aspx)
with 3,032 (1,919; 2,169) views.
|
|
TOP
10 STATLIT-SITE SEARCH-TERMS |
Top 13 terms in search referrals to
www.StatLit.org.
Search referrals (2010, 09; 08; 07) References
shown are likely targets.
Search phrases totals (14,022; 21,222).
-
Joel Best (835; 1,147; 594):
See Joel Best author page. [Billie
Joel?]
-
graphs (567; 654; 634): Schield
Percentage Graphs in USA Today
-
Howard Wainer (424;340; 110): See
Howard Wainer
author page.
-
Statistical Literacy
(341; 385; 249): See Statistical Literacy.
-
Quantity words (317; 547; 264): Schield, Why
Students Use 'Many'?
-
Standardiz... (240; 100; 131):
Schield, Adjusting for
Confounding Graphically.
-
Numeracy and Math across curriculum
(197; 75; 60): See Numeracy
-
Significance, substantial and statistical (168)
-
Gerald Bracey (162; 214; 94): See
Gerald Bracey author page.
|
-
Data (80)
-
Simpson Paradox
(45; 59; 54): Schield, "Adjust for
Confounding Graphically".
-
Social construction and ambiguity (38): See
Schield, Teaching the Social
Construction of Statistics
-
quantitative reasoning (22; 33):
See Numeracy or Q/L
Each month, LiveStats ranks the search
terms used and captures the top 20 with the associated number of
referrals. In 2010, this generated more than a hundred unique
search terms with 2,950
visits (plus 11,160 Other) for a total of 14,110 total search
referrals. These 92 search terms were grouped by search phrase
(so 'standardizing' and 'standardized' were counted together) into
30 groups. Note that these numbers are very sensitive to
how search terms are grouped into search phrases. Note that
most of the search
referrals are tabulated under Other.
|
|
GOOGLE STATLIT-SITE RANKINGS |
|
Google rated www.StatLit.org as the #1 site for Statistical Literacy for the
6th year. Google ranking (12/10) of
www.StatLit.org.
When two words are shown, they
are searched as a phrase.
#1: Statistical literacy, Joel
Best, Howard Wainer, Bernie Madison, Othmar Winkler,
statistical prevarication, chance grammar, percentage graphs, social
construction statistics, spurious association, statistical
doublespeak, statistical paradoxes, data literacy and StatLit.
#2: Dennis Haack, Milo Schield,
statistically literate, social construction rankings
#3: percentage grammar, adult
numeracy
Top 10:
journalistic significance (5),
standardizing (6), USA Today
graphs (6),
interpreting doublespeak (6), John Paulos (6), Gerald Bracey (6), multivariate thinking (7), quantity words (8),
data literacy (8), Jane Miller statistics (9), David Phyllis
Whitin (9), Marc Isaacson statistics (10).
|
Top 30:
Simpson's paradox (13), innumeracy (15),
Gigerenzer (17),
Lynn Steen (21), numeracy (21),
statistical
reasoning (26).
Top 100 (estimated ranking): statistical illiteracy (32),
confounding (37), confounder (43),
statistically illiterate (46), quantitative literacy (64), quantitative
reasoning (65), statistical education (70), social construction (75),
Katherine Wallman (80), Marc Isaacson (90).
This site was not in the first 100 for chance, confound,
confounded, critical thinking, effect size, financial literacy, graphs, health literacy, health numeracy, induction,
information literacy, interaction,
Jane Watson, randomness, significance, spurious, standardization, statistics
or Take care.
Process: Search on phrase (in quotes); Find "StatLit.org" on page.
|
|
TOP 10 DOMAIN REFERRAL SITES |
|
Search
Engines rankings (by hits?) Total (2010): 61,557 (8,563 Other)
#0: 11,393
www.dailyspeculations.com
[linked to a picture]
#1: 10,510
www.google.com
#2:
8,563 ilt.ilstu.edu
#3: 1,263
www.google.co.uk
#4: 1,165 search.yahoo.com
|
#5: 1,056
www.bing.com
#6: 1,040
www.google.co.in
#7: 833
www.google.ca
#8: 724 picsdigger.com
#9 600
www.google.com.au
#10: 393 mathforum.org
|
|


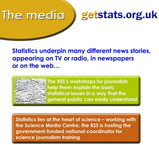
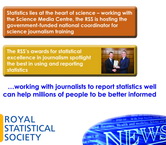
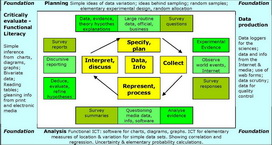


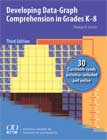

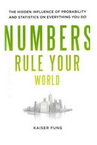
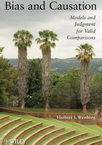
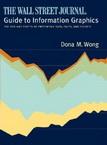
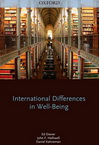
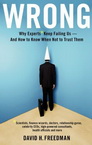
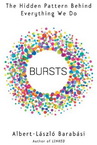
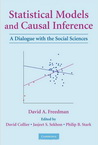
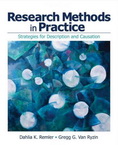
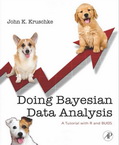


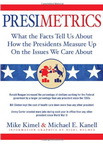
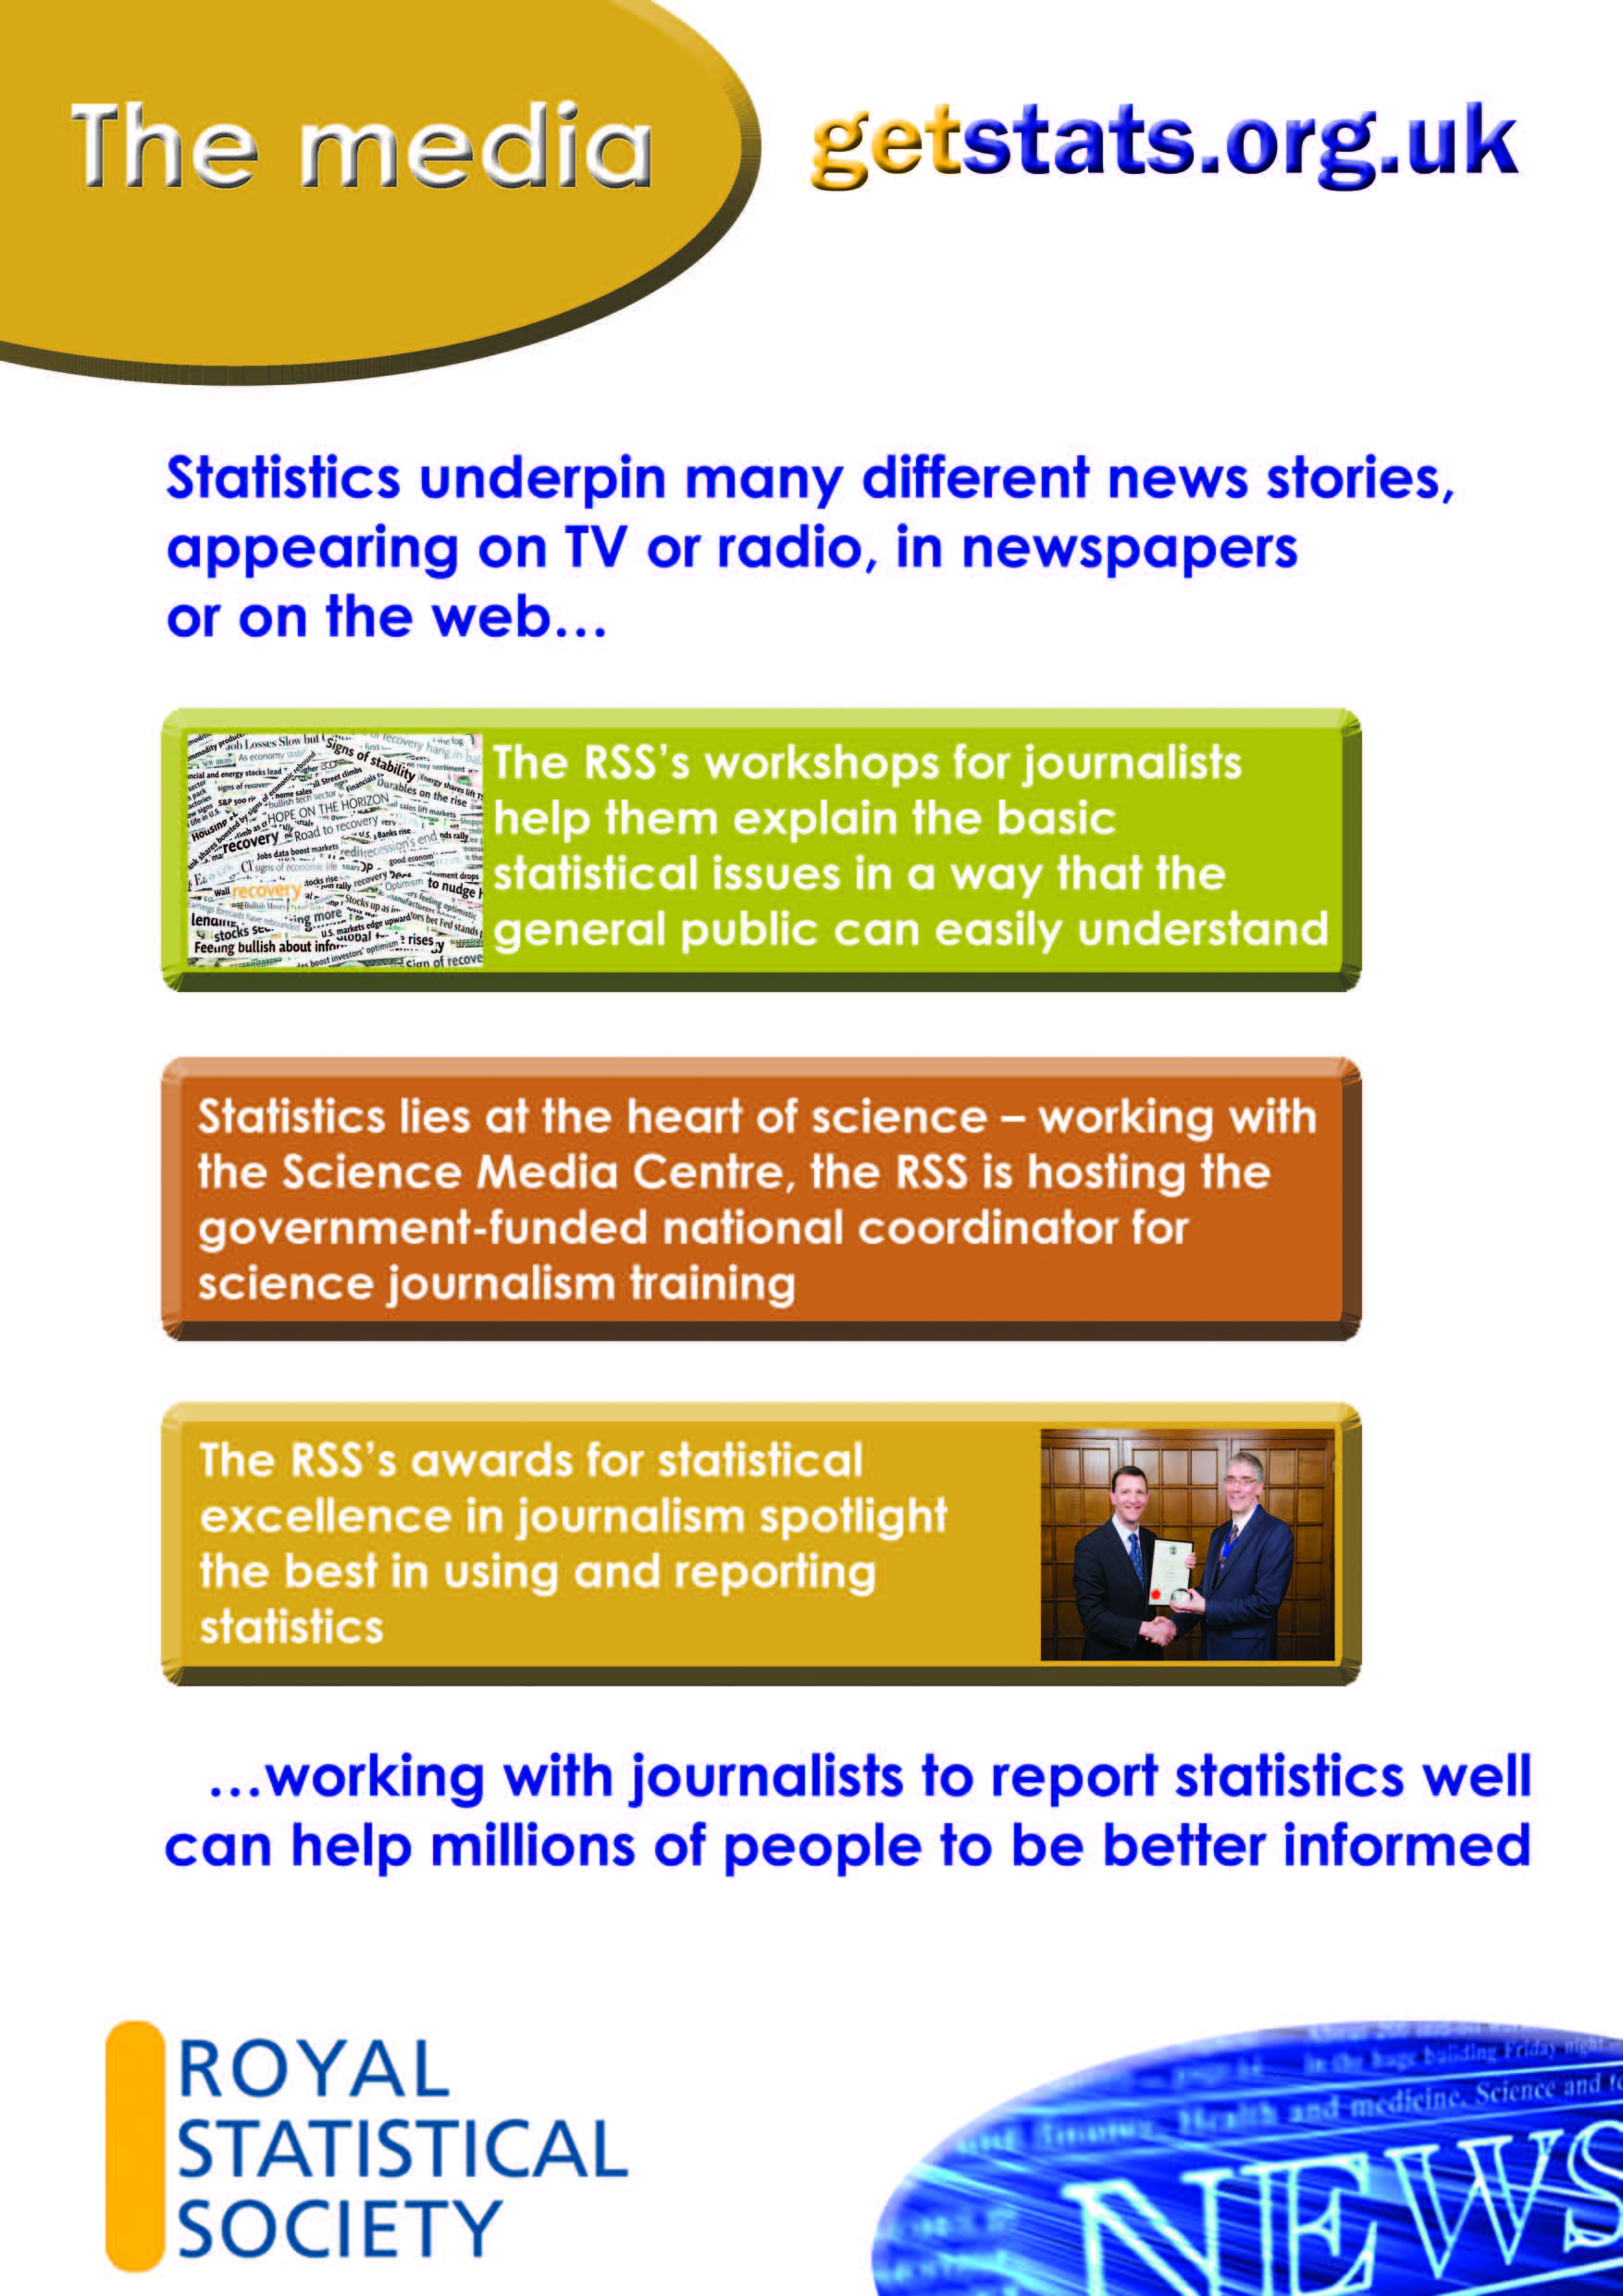