|
NEWS IN
2007
|
|
Evidence
of continuing growth in 2007:
-
Grant funding up with over $1 million for
numeracy projects.
-
Web traffic up 40% on visits, 60%
on downloads and 160% on referrals for www.StatLit.org: 85,000 visits, 66,000 downloads and 12,000 referrals.
-
GAISE impact is being felt:
The GAISE call for statistical literacy has implications on course
content. See the first quote shown below.
|

Blogger touts numeracy:
May
16, 2007: Blogger John Walker said Schield's 2006 ASA paper,
Percentage
Graphs in USA Today, was "technical" but "pretty interesting."
Walker's review contributed to over eight thousand viewings of this paper in one year: a
new high for any article hosted on this site. |
|
MEMORABLE QUOTES |
|
GAISE
Limits:
"You simply can’t achieve these [GAISE statistical literacy] goals in
one course if you also teach a long list of methods. Allan
Rossman
Definition of
QL: "the definition of quantitative literacy should be
expanded to include 'construction' – the social process by which numbers are
created." Joel Best
Hypothetical Thinking:
"hypothetical thinking is absolutely critical once one accepts that all
statistics are socially constructed" Milo Schield
Statistical
Literacy: "Most students would be better served by a Stat 100
[statistical literacy] course than a Stat 101 [methods] course."
Allan
Rossman
Causality: "Causal inference is
inherently multivariate."
Donald Rubin
Math-Stats Education: "Traditional education in mathematics and statistics is not
sufficiently effective for the quantitative reasoning required."
Bernie Madison
Liberal Education:
"Quantitative literacy should be a standard
outcome of a good liberal education." David Van Wylen, Associate Dean,
Saint Olaf
College Students:
"Twenty percent of U.S. college students
completing four-year degrees have only 'basic' quantitative literacy skills."
Dr. Mathew Ladner
College Students:
"19% of my students in professional majors could
not accurately interpret the meaning of 40%." Christine
Duller, Univ. of Linz, Austria
Psychology:
"Rosnow and Rosenthal called interaction
effects the universally most misinterpreted results in psychology."
Kathy Green, U of Denver
News Articles:
"55% [of news articles involving numbers]
use words that imply causation when asserting causation is very disputable."
Milo & Cynthia Schield
Conjunction Mistake: "By the reasoning of Kahneman et al, most
statistical educators are guilty of the conjunction effect mistake."
Schield and Burnham |
|
QR/QL Projects |
|
In 2007, the
NSF
awarded the University of Arkansas $392,579 to fund QRCW with Bernie
Madison (Mathematics) as the PI. This is not a proposal to produce a textbook in the traditional sense,
[but to produce] a casebook ... of
quantitative reasoning that derives from original, recent media
articles. |
Quantitative Reasoning in the Contemporary World (QRCW)
Traditional education in mathematics and statistics is not
sufficiently effective for the quantitative reasoning required. This
project is continuing development of ... an innovative QR course
and includes making the course transportable, adaptable, and more
effective. |
|
In 2007, the
NSF
awarded Carleton College $499,994 to fund QUIRK with
Nathan Grawe
(Economics) as PI. This
project is engaged in ongoing assessment results that are being used to
guide curricular reform through faculty workshops and course and writing
assignment revisions.
|
Quantitative Inquiry, Reasoning & Knowledge (QUIRK)
The multi-disciplinary character of
quantitative reasoning places it outside traditional models of
curricular reform, and presents challenges for traditional curricular
reform and assessment strategies. |
|
In 2007, the
NSF
awarded the Univ. of Wyoming $140,495 to fund Preparing Students
for Citizenship: Fostering Critical Thinking and Problem Solving Skills
through Quantitative Reasoning and Scientific Literacy.
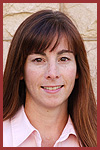
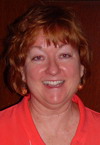
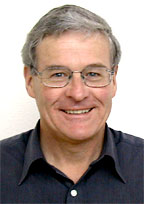
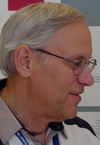
Erin Campbell-Stone
(right) and James
Myers (Geology Dept.) are co-PIs. |
Preparing Students for Citizenship
By presenting science in context, the
project is demonstrating the importance of scientific literacy and
quantitative reasoning, enticing students into STEM fields and
encouraging students to view sustainability from different global
perspectives. It is also showing how societal problems must be addressed
by tempering science, technology and engineering with social, political
and cultural norms. |
|
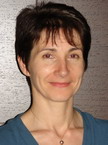
In 2006, the
NSF
awarded Colby-Sawyer College $149,290 to fund Q/L Across the
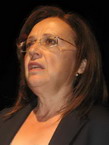
Curriculum in a Liberal Arts Setting.
Semra Kilic-Bahi (Math Dept, left) is the PI along with Benjamin Steele,
John Callewaert, Randall Hanson and Lynn Garrioch.
See also the Colby-Sawyer College news article
on this college-wide endeavor. |
Q/L in a Liberal Arts Setting
The goal of the project is to incorporate
Quantitative Literacy (QL) learning materials and teaching strategies in
courses throughout the curriculum. It is improving the ability of
students at the college to formulate, evaluate, and express conclusions
and inferences from quantitative information using analytical arguments,
reasoning, and fundamental mathematical skills. |
|
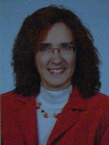
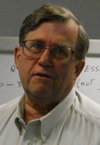
IN 2006 the
NSF
awarded James Madison Univ. $498,765 to fund Advancing of
Assessment of Scientific and Quantitative Reasoning.
Donna Sundre
(Center for Assessment and
Research, right) is PI along with Christopher Murphy, Mary Handley, Carol Hurney and Richard West. |
Assessing Scientific & Quant Reasoning
JMU is currently using ... instruments
designed to measure collegiate scientific (SR) and quantitative
reasoning (QR) skills and knowledge. [Our research base has demonstrated
the reliability and validity of scores.] Recent research supports the
hypothesis that current scientific and quantitative reasoning goals and
associated assessment instruments can successfully be modified for use
by other institutions... |
|
NEW BOOKS |
|
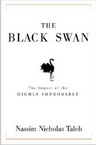
Nassim Taleb's "The Black Swan: The Impact of the Highly Improbable" was
published in 2007. Highlights problems using a single event or
sequence of events (no matter how improbable) to predict the future or
to make policy decisions. Follows the style of his earlier book,
"Fooled by Randomness: The Hidden Role of Chance in Life and in the
Markets." |
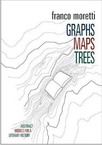 Graphs,
Maps, Trees: Abstract Models for a Literary History Graphs,
Maps, Trees: Abstract Models for a Literary History
Franco Moretti argues
heretically that literature scholars should stop reading books and start
counting, graphing, and mapping them. This could bring new lustre to a tired field, one that
is among "the most backwards disciplines in the academy."
(1st ed., 2007) |
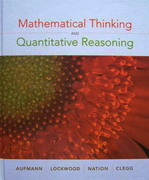
By Aufmann, Lockwood and Nation (1st ed., 2007) Designed for the non-traditional Liberal Arts course.
Focuses on practical topics that students need to learn in order to be
better quantitative thinkers and decision-makers. Chapters on
diverse topics including Logic, Linear Models and Finance.
See Table of Contents. |
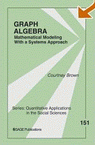 Graph
Algebra:
Math Modeling Graph
Algebra:
Math Modeling
by Courtney Brown (1st ed., 2007).
Introduces a new modeling tool for the social sciences. Derived from
engineering literature that uses similar techniques to map physical
systems, graph algebra utilizes a systems approach to modeling. |
|
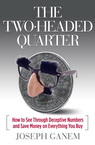
The Two Headed Quarter by Joseph Ganem exposes everyday consumer
deceptions and provides real-world tips and tactics to 'beat 'em at
their own game'. Like flipping a two-headed quarter, many of the
so-called deals you make each day are rigged so that no matter which
side the coin lands on, you pay. Joe also gave a talk at the 2011
ASA. 6up. |
|
|
2007 USCOTS |
|
In his plenary address at USCOTS,
Allan Rossman noted
that "You simply can’t achieve these [GAISE statistical literacy]
goals in one course if you also teach a long list of methods." He
suggested that "Most students would be better served by a Stat 100
[statistical literacy] course than a Stat 101 [methods] course."
Slides {**A must-read for statistical educators.**} |
Andrew
Zieffler and
Michelle
Everson (U. MN) showed how they implemented the GAISE
guidelines. "Students are encouraged to explore and critique
statistical applets, web resources, graphs and articles that use
statistics." "Few calculations are required..." |
|
National Numeracy Network (NNN) |
|
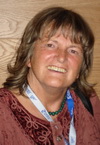
Neil Lutsky (left), Joel Best (below) and
Milo Schield (lower right) were invited by the
AACU to present Numbers Count! Civic-Based Numeracy across the
Curriculum. Schield presented "Civic
Engagement: Numbers in the News."
Lutsky talked on "Promoting Numeracy Across the Curriculum."
NNN also held an
open-house at the American
Statistical Assoc. |
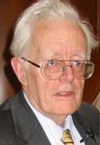
Bernie Madison (right), NNN founder, organized a
Wingspread
retreat on "Teaching
School Teachers QL." Speakers included Joel Best (lower left),
Corrine Taylor (NNN President, Wesley ), Neil
Lutsky (left, Carleton) and Milo Schield (below, Augsburg, NNN VP). Schield presented Quantitative Literacy
and School Mathematics: Percentages and Fractions with
slides. |
|
Joel Best presented "Including
Construction
in Q/L" arguing that in addition to "calculation" and
"application", the definition of Q/L should include "construction:"
the social process
by which statistics are created.
Best's presentation was part of
the the pre-conference workshop on Q/L
at the meeting of the Midwest Sociological Society (MSS). |
Milo Schield presented "Teaching
the Social Construction of Statistics" with
slides at the 2007 MSS.
Taking Best's claim that
all statistics are socially constructed,
and
Isaacson's claim that seeing this requires
hypothetical thinking, Schield
identified right-wrong exercises designed to help students think hypothetically.
Includes Moodle field-tested examples. |
|
At the 2007 Midwest Sociological Society,
Sue Mente, Instructional Services Center (ISC) Coordinator,
Alverno Q/L Program) showed how
QL assessment
works at the college, course and student levels at Alverno.
Examples shown. See
Alverno Levels of Q/L,
Where We've Been and
Where We Are Going. Carla Howery organized this "QL in
Sociology" session. |
Eric
Gaze (Alfred University) presented
Teaching Social Justice by the Numbers at the 2007 Midwest
Sociological Society. He focused on the
importance of ratios and the need for an "industry standard" on the
basic Q/L tool set. Slides.
{This paper has an excellent grounding on ratios. Gaze makes excellent points about what
needs to be done in Q/L.} |
|
Data Librarians |
 Stat
Lit at the Reference Desk Stat
Lit at the Reference Desk
In his slides,
Jeff Moon
(Stauffer Library, Queens University) presented topics such as "numbers
vs. percentages."
In her slides, Sue Giles (Ryerson
University Library) reviewed basic statistical literacy questions. These were presented at the 2007 Ontario Library
Association's (OLA) Super-Conference along with "Reading Tables 101". |
Lain Ruus (University of
Toronto Data Services) presented "Reading
tables 101" using tables from official sources. Ruus
focused on three point:
1. Know the difference in comparing two rates and proportions within
a
100% column or row vs. comparing between two such columns or
rows. 2: Identify what's in the numerator as
well as what's in the denominator. 3. Whenever possible, go
back to the original data. {A thought-provoking
presentation with great examples.} |
|
Statistics Canada's
Learning Resources website released a
Teacher’s Guide to Data
Discovery developed by Mary Townsend. It helps teachers find interesting and grade-appropriate datasets,
choose appropriate graphs for different kinds of data and calculate
basic statistical measures. See also her 2006 paper, "Developing
Statistical Literacy in Youth." |
Papers presented at the 2007 IASSIST include "Quantitative
Methods Capacity Building in Scotland" by Robin Rice (right, Univ. Edinburgh),
"Improving Statistical Literacy
at Statistics Finland" by Reija Helenius, and "Statistical
Literacy / Numeracy Initiatives, Statistics Canada" by David Roy. |
|
Libbie Stephenson (right) and Patti Caravello
(UCLA) presented
Incorporating Statistical Competencies into University-Level Information
Literacy Programs in the Social Sciences at IASSIST 2007. |
Michelle Edwards (Coordinator, Guelph Data Resource
Center) presented Numeracy at Guelph at the 2007 IASSIST
conference. The goals is to "enrich programs with high competencies in
numeric and quantitative reasoning skills as well as reach out to those
programs that are traditionally weak." |
|
AMATYC and
ISLP |
|
  Q/L @ AMATYC Q/L @ AMATYC
Rebecca Hartzler
(left) & Deann Leoni (right) reviewed
Math Across the Curriculum
and Quantitative Literacy.
Bernie Madison
talked on
MAC & QL. |
Under the leadership of the new director, Juana Sanchez (UCLA),
the International Statistical Literacy Project (ISLP) site has a new
web face, new page coordinators and new resources for teachers at all levels world-wide. The
ISLP also sponsors the
International Statistical Literacy
Competition for 10-18 year old students. ISLP review of
Statistical
Literacy assessments. |
 Implementing
QR at BMCC Implementing
QR at BMCC
Developing and Implementing a Quantitative Reasoning Program at BMCC, by
Klement Teixeira. AMATYC Spring 2007 issue, Vol. 28, No.2 |
 Some
Successful QR Strategies Some
Successful QR Strategies
Some Procedures, Methodologies and Strategies
on the Successful Implementation of Quantitative Reasoning Mathematics
Courses Professor by Klement Teixeira (left) and Frederick Reese
(right). Includes a section on "How to attract students to the QR
courses."
|
|
IPM42 @
ISI 2007
(Lisbon) |
|
Donald Rubin (Harvard University) gave a talk on Dealing with
Multivariate Outcomes in Causal Studies. Rubin noted, " "Causal
inference is inherently multivariate even just for a
single experimental unit and only two exposure conditions..."
Abstract
and slides. |
David Cox (Oxford) and
Nanny Wermuth
(Chalmers) presented Some Interpretational Issues Involving
Observational Studies.
Abstract and slides.
See also David Cox's 2004
Fields lecture.
IPM List,
STCPM List,
CPM List,
IASS Short Courses |
|
James
Nicholson,
Jim Ridgway
and Sean McKusker (U.
Durham) presented Using multivariate data as a focus for multiple
curriculum perspectives at secondary level.
Abstract
and
slides. |
John Harraway (Univ. of Otago) showed videos used to teach students
about confounding.
Abstract,
slides. The IASE invited session
IPM-42,
Observational Studies, Confounding & Multivariate Thinking was
organized & chaired by Milo
Schield. |
|
IASE 2007 (Guimarães,
Portugal) |
|
Juana Sanchez (UCLA), head of the
International Statistical Literacy Project, presented Building
Statistical Literacy Assessment Tools with the IASE ISLP. She
classified models of statistical literacy as either "sequential" (by topic) or
"longitudinal" (by developmental level). |
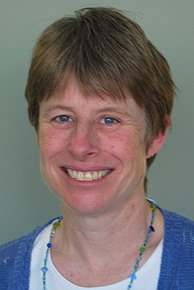
Stephanie Budgett (right) and Maxine Pfannkuch (Univ. Auckland)
presented Assessing Students'
Statistical Literacy in their course entitled Lies,
Damned Lies, and Statistics which included risk, statistical
reasoning and statistics and the law. |
|
Christine Duller (Univ. of Linz) presented Doing
Statistics versus Understanding Statistics at the IASE and Do
You Speak Statistics? at the ISI. Her study of Austrian
college students found that 24% of the women misunderstood the meaning
of "40%." 10% picked a fourth (1 in 4), 10% picked a fortieth (1
in 40 or 10 in 400) and 4% picked 1 in 25. |
Nick Broers (Maastricht Univ.) presented Designing Open Questions
for the Assessment of Conceptual Understanding using the
didactic method of propositional manipulation (MPM). Student
responses allow scoring propositional knowledge and conceptual
understanding. |
|
Jim Ridgway (left) and James Nicholson (right)
(U. Durham) presented
Embedding Statistical Assessment within Cross-Curricular Materials
for multi-variable perspectives. See also their ISI paper
(above) on a related topic. |
Michelle Sisto (U. Monaco) presented Using Peer Assessment of Project
Presentations to Develop Skills as Consumers of Statistical Information. As
a result, "many more students also now use some form of statistical
reasoning and analysis in their final thesis projects before
graduating." |
|
Kathy Green
(U. of Denver) presented Assessing
Understanding of the Concept of Interaction in Analysis of Variance.
Interaction effects have been labeled the “universally most misinterpreted
results in psychology.” Exercises
for teaching their proper interpretation were presented.
|
Larry Weldon (Simon Fraser U) presented
Assessment
of a Writing Course in Statistics which seeks to improve students
ability to explain statistical concepts and topics in writing and
verbally. A marking protocol is introduced along with a suggested
weighting of components. |
|
Milo Schield (Augsburg) presented
Statistical Literacy: Factual Assessment to Support
Hypothetical Thinking. This paper reviews 130 different types of statistical literacy
right-wrong exercises (Moodle based). These are not typical
exercises. Only half of these have a numeric answer while only a
tenth involve randomness. Slides. |
Iddo Gal (Univ. Haifa) presented Critical Areas for Assessing Skill
Transfer: Statistics Education and PIAAC. He presented some of
the design principles of the numeracy assessment in PIAAC, and solicited
suggestions for possible assessment tasks. |
|
ASA: Statistical Literacy |
 Statistical
Literacy: 2007 Statistical
Literacy: 2007
Paul J. Fields (Brigham Young University) chaired the 2007 session on Statistical
Literacy at the national meeting of the American
Statistical Association. This is the 10th session on
statistical literacy organized by Milo Schield. Paul is the
editor of STATS magazine. |
Marshall
Schield (President of STIR Research) analyzed the prevarication in
a famous mutual fund study that tried to show that 'buy and hold" was
better than relative strength investing. After untangling the
prevarication in their procedure, Marshall used their approach to show that relative strength investing was superior
to "buy and hold."
Slides |
|
Cynthia Schield, former co-publisher of the
Napa County Record,
presented Numbers in the News: A Survey -- co-authored with Milo Schield
(right). Their paper analyzed 250 news articles involving numbers and tabulated the
prevalence of 99 different types of statistics and their use as evidence
for causation. Slides |
Milo Schield (Augsburg College) and Tom
Burnham (Cognitive Consulting) reviewed The
Grammar of Statements Involving Chance. A
survey of those attending showed there was uncertainty among statistical
educators on to how to interpret some simple statements involving "chance".
Slides |
|
Stephen Doig, Professor in the Cronkite School of Journalism at Arizona
State University, spoke on "Statistics and Innumerate Journalists." He
claimed that statistical educators -- not journalists --
needed to accept responsibility for teaching p-values.
Slides |
Kay Somers (Moravian College) talked about "Quantitative Reasoning:
An Activity-Based Course with Real Data and Relevant Issues."
This course uses the new textbook "Quantitative
Reasoning: Tools for Today's Informed Citizens" that she
co-authored with Alicia Sevilla.
Slides |
|
ASA 2006 |
|
In "What do M&M's, dahlias, soil erosion and
data analysis across the curriculum have in common?," Jerry
Moreno (John Carroll U.) reviewed his work to implement statistics in
the local K-12 math curriculum. He says "the importance of having
a statistically literate citizenry is to (1) read a newspaper more
intelligently... and (2) become a better decision maker."
|
John D. McKenzie (Babson College) presented
"Some Ways to Increase the Use of Graphs throughout the Introductory
Applied Statistics Course." McKenzie said "I continue to be
disappointed by the lack of any graphs in the test questions constructed
by my colleagues... If something is important [enough] to be
covered in class and assigned as .. homework, it should be assessed."
|
|
David Kriska (Walden U.), Marc Fulcomer
(Stockton College of NJ) and Marcia Sass (UMD-NJ) presented
Expectations for Statistical Literacy: A Comparison among Professions"
They noted that statistical topics taught at college should be
influenced by those topics used at work after college. They
proposed a survey instrument to evaluate "statistical expectations held
by employers and instructors of statistically literate workers and
students." |
Robert Carver (Stonehill College) presented "Ambiguity
Intolerance: Impediment to Inferential Reasoning?" He noted
that "low tolerance for ambiguity could either impede or enhance
...inferential reasoning." He found "limited evidence that students with
low ambiguity tolerance may more successful develop ...inferential
reasoning." |
|
QL in Geosciences |
|
Len Vacher (University of South Florida) organized "Spreadsheets
Across The Curriculum (SSAC):" an NSF-sponsored
three-year
project that uses spreadsheets to promote quantitative literacy. See
Vacher's presentation on "Some
Examples of Teaching Numeracy." This was presented that the 2006
conference at Carleton College. |
This conference, organized by Cathy Manduca (right, Carleton), Eric Baer
(Highline Community College) and Jen Wenner, U. Wis., Oshkosh) was held
at Carleton June 26-28, 2006 on "Infusing Quantitative Literacy into
Introductory Geoscience Courses." In 2007, Cathy became
President
of the National Association of Geoscience Teachers (NAGT). |
|
GENERAL NEWS |
|
Indiana State University received a grant (10/2007) from
Teachers for a New Era,
a national initiative of the Carnegie Corp. The two-part grant
will help teachers learn how to better assess their pupils’ progress
as well as to interweave math throughout all subjects. |
Kentucky Includes S/R in Gen Ed
The Gen Ed curriculum would
likely also include a four-credit-hour writing course as well an
advanced writing seminar. On top of that, students would take courses in
statistical reasoning and one called first-year orientation that serves
as an introduction to college.. |
|
The
University of Wollongong has been named as part of a successful
consortium to enhance the literacy and numeracy skills for Australian
teachers. “Up to 1,000 of Australia’s best teachers will have the
opportunity to attend an all expenses paid 10-day residential course to
enhance their training in one of five areas -- literacy and numeracy,
English, maths, science and Australian history.” |
Empirical Reasoning @ Harvard
Harvard University proposes a new general education curriculum which
includes a focus on empirical reasoning:
"to help students learn how to
make decisions and draw inferences that involve the evaluation of
empirical data and how to gather and assess information, weigh evidence,
estimate probabilities, and solve problems with the data available." |
|
Grant: To Address Numerical Skills
The University of Central Lancashire (UCLan) has been awarded £200,000
by the National Teaching Fellowship Scheme (NTF) for a three-year
project addressing undergraduates’ numerical skills. The study will
identify the numerical knowledge and skills required within history,
bioscience (including nursing) and business studies and how they might
be better developed within curricula. |
David Van Wylen, associate dean for mathematics and natural
sciences, says that quantitative literacy should be a standard outcome
of a good liberal education. “Understanding [science and math] is a
transferable skill.” [Lynn] Steen says that... St. Olaf students ... all need to understand an increasingly
quantitative world. (2007 AACU) |
|
The
UN Statistical Literacy Project aims to
develop the capacity to access and use statistical information to
enhance evidence-based policy making at the country level. Student
materials focus on data users and the practical application of
national statistics. |
 Kinds
of Math Kinds
of Math
by Keith Devlin (10/2007) Written, symbolic
mathematics is not "merely" a written version of the mental activity I
am calling "everyday math." Indeed, from a cognitive standpoint, I
believe it is a very different mental activity. |
|
Dr. Mathew Ladner notes a study that finds 20% of U.S. college students completing four-year degrees
have only what the researchers describe as basic quantitative literacy
skills, meaning they can't estimate if their car has enough gas
to get to the next gas station. The study also finds more than 50
percent of students at four-year colleges have only the most basic
literacy skills, meaning they can't do basic tasks like summarize
arguments in a newspaper editorial. |
Graphwise: Charting a World of Data
Graphwise is web site dedicated to accumulating tables of data
(approaching a million), storing them in a common format and providing a
variety of graphical tools for their display. The site is
currently in beta. Try the
Google Mapwise
gadget to get started.
12/2008: Graphwise site (www.Graphwise.com)
is not available. |
|
Statistical literacy is
an important skill because you are
constantly exposed to information from surveys and scientific
experiments which are designed to tell you something about yourself. How do you know that these findings are accurate? Statistical
literacy provides us with the skills to answer these questions. Without
these skills you might ...suffer from the serious disorder of dys-statistica: "an irrational fear of
statistics and a confused perception of the world". |
Daniel Schafer
(Oregon State, co-author of The Statistical Sleuth) has part of his Blog
titled Statistical Literacy for Citizenship. Recent posts
include Evolution from
'statistical methods' to 'data analysis',
It's about the conclusions,
stupid!, and Statistical
Literacy -- Its' more than just Understanding the News. Daniel
is writing "An
Introduction to Statistical Thinking."
TOC. |
|
By Liz Gibson, John Marriott and Neville Davies Royal Statistical
Society Centre for Statistical Education Nottingham Trent. "Smith had
suggested that statistics education might be improved by teaching it
through other subjects, such as science and geography, rather than from
its current position in the mathematics curriculum. In section 2 we
describe the national survey we carried out with a summary of the key
findings.... Section 5 discusses teaching statistics using a problem
solving approach at undergraduate level." |
By Persell, Pfeiffer, and Syed. Teaching Sociology 35:300-14. Oct
2007 vol. 35 no. 4 P 300-314. Our
research questions include: What do leaders think students should
understand after an introduction to sociology course? Do the goals of
Teaching Award winners differ from those of other leaders? How do the
leaders' goals compare with those expressed in leading SoTL
publications? We interviewed a 44 leaders in 2005-2006. Using
qualitative content analysis, we systematically coded, analyzed, and
compared their goals. See also Percell 2006 and 2010. |
|
New Editions |
By Coladarci et al (2003, 2nd ed. 2007).
Gives educators the statistical knowledge and skills necessary in
classroom teaching, in running schools and in professional development.
Emphasizes conceptual development. |
By
Lemuel A. Moyé (2nd ed., 2006). Illustrates the correct use of statistics in
health care research for health care workers. Supplemented by new
descriptions of absolute risk, relative risk and Number Needed to Treat
(NNT). Delivers principles to the uninitiated. |
by
Glenberg and Andrzejewski (3rd ed. 2007). For intro courses in
psychology, education and other applied social and health sciences.
includes effect sizes in all discussions of power. Designed to be used
with Excel. |
By
King and Minum; 5th Ed., 2007. Focuses on conceptual growth.
Helps readers understand statistical logic and procedures, the
properties of statistical devices, the importance of the assumptions
underlying statistical tools. |
 Stats:
Data and Models (2nd) Stats:
Data and Models (2nd)
By De Beaux, Velleman and Bock (2nd ed.,
2007). See chapter 2 (Displaying and Describing Categorical Data
), chapter 7 (Scatterplots, Association and Correlation), and Ch 11
(Exploring Relationships between Variables). Investigates
confidence intervals and hypothesis tests on proportions before doing
these for means and regression. |
 Using
and Understanding Math: A Q/R Approach (4th) Using
and Understanding Math: A Q/R Approach (4th)
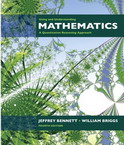
Bennett and Briggs (4th ed., 2007). Provides
students with the mathematical reasoning and quantitative
literacy skills they'll need to make good decisions throughout their
lives. Common-sense applications of mathematics . |
|
TOP
40 SITE-PAPERS VIEWED |
Top 40 Site-Papers Viewed at
www.StatLit.org in 2007
From 2006,↑
is up 50%,
↑↑ is doubled,
↑↑↑ is 3X and
↑↑↑↑ is 4X.
-
-
-
Exploring Simpson's Paradox, Larry Lesser (Univ. Texas, El Paso) NCTM 2001 (1,293)
-
Three Paradoxes,
Howard Wainer, Nat. Board of Medical Examiners. Draft for The American Statistician 2004 (1,281)
-
-
-
-
-
-
-
-
-
-
Statistical
Prevarication: Telling Half Truths Using Statistics, Schield,
2005 IASE (520↑↑↑↑)
-
-
-
-
-
|
-
-
-
-
-
-
-
-
-
-
-
-
-
-
-
-
-
-
-
-
-
-
Planning a Statistical Literacy
Program at the College Level: Musings and Bibliography by
Bob Hayden, 2004 ASA (53)
In 2007, there were 330
downloadable files (announcements, papers or slides) at
www.StatLit.org.
Schield authored/co-authored 119. |
|
TOP
20 SITE-PAGES |
Top 20 StatLit Web Pages Viewed at
www.StatLit.org in 2007.
(###)
is number of
"page views." Voluntary 2007 page views: 48,809.
-
Welcome (11,010, 29%): Home/Index
page. Site overview.
-
W. M. Keck StatLit Survey (3,034,
8%): Detailed on-line 2002 survey.
-
Q/L Textbooks
(2,223, 5%): Details on Q/R or Q/L textbooks.
-
StatLit Papers
(2,085, 5%): Papers, articles or slide presentations.
-
Joel Best
(1,864, 5%): Author of "More Damned Lies & Statistics"
-
StatLit News 2006 (1,714, 5%):
Stat-Lit related News from 2006.
-
Standardizing (1,477, 4%): Excel graph
illustrates standardizing.
-
Gerald
Bracey (1,416, 4%):
Author "Reading Educational Research"
-
StatLit Books
(1,414, 4%): List of over 300 Stat-Lit related books.
-
John Paulos (1,138,
3%):
Author of "Numeracy".
-
Howard Wainer (1,119,
3%):
Author of "A Tout in the Milk".
-
Q/L Books
(1,116, 3%): Details on Q/L-related books (not texts).
-
Dennis Haack (1,053,
3%):
Author of "Statistical Literacy" 1979.
|
-
Q/L Activities
(1,020, 3%): Details on Q/L-related activities.
-
StatLit
News 2004
(1,012, 2%): Stat-Lit related News from 2004.
-
Gerd
Gigerenzer (957, 2%):
Author of "Calculated Risks"
-
StatLit
News 2005
(876, 2%):
Stat-Lit related News from 2005.
-
StatLit News 2003
(850, 2%): Stat-Lit related News from 2003.
-
Statistical
Reasoning Textbooks (695, 2%)
-
StatLit Tools
(412, 1%): Links to Stat-Lit related tools.
Other StatLit site pages include
Information Literacy (355),
numeracy books (343),
StatLit Survey (296),
Schield (253), Percentage
Table Survey (219), StatLit 2007
(195), adult numeracy (185) and
Search contact/StatLit Site (161) plus
the new navigation pages: Statistical
Literacy (154), Statistical
Reasoning (115), StatLit News
(101), Authors (100) and
Numeracy (98).
The
grammar-checker program (SLRSV.aspx) had 16,957 views and the
Part-Whole program (PartWholeImages.aspx)
had 6,230 views.
These pages (/GC) and those used exclusively by Capella students
(/CP) are not listed because students are required to use them.
Total page views: 73,723. |
|
TOP
20 SITE SEARCH-TERMS |
Top 20 terms used in search referrals to
www.StatLit.org in 2007 ranked by number and
percentage of referred visits.
The reference
shown is a likely target for this search.
-
USA Today graphs (634, 27%): Schield
Percentage Graphs in USA Today
-
Joel Best (594,
25%):
See Joel Best author page.
-
Quantity words
(264, 11%): See Schield, Why
Students Use 'Many'?
-
Statistical Literacy
(249, 11%): See Statistical Literacy.
-
Standardiz... (131, 6%):
Schield, Adjusting for
Confounding Graphically.
-
Lord Paradox
(126, 5%): See Wainer's article,
Three Paradoxes.
-
Howard Wainer (110, 5%): See Howard Wainer
author page.
-
Percentage Tables (101): See Schield,
Reading Tables of Rates & Percents.
-
Statistics research
(95): See StatLit Tools page.
-
Gerald Bracey (94): See Gerald Bracey author page.
|
-
Simpson Paradox
(54): See Schield, "Adjust for
Confounding Graphically".
-
Percentage graphs (44):
See Schield, Percentage Graphs in
USA Today.
-
StatLit (24): See the name of this site.
-
Quantitative Literacy (20):
See Numeracy or Q/L
-
Capella University
(19): See Isaacson's Statistical Literacy
at Capella.
-
Bernie Madison
(17): See Madison's
Pedagogical
Challenges of Q/L.
-
Statistical paradoxes
(16): See Wainer and
Schield.
-
role of statistics in research (16).
-
Percentages
(15): See Schield's Grammar of
Rates and Percentages.
-
Doublespeak
(14):
See Dennis Haack (9).
Each month, LiveStats ranks the search
terms used and captures the top 20 with the associated number of
referrals. In 2007, this generated 60 search terms with 2,355
visits (or the 11,874 total search referrals). This list is taken from the 60 search
phrases. The numbers shown are the "visits
referred" for the StatLit.org website grouped by search phrase
(so 'standardizing' and 'standardized' were counted together).
Three search phrases were omitted: Augnet, teaching inferences and
activities.
|
|
GOOGLE SITE RANKINGS |
|
Google ranking (12/2007) of
the
www.StatLit.org web site based on the search
term shown.
#1: Statistical literacy, Bernie Madison,
statistical prevarication and
confounder resistance
#2: Joel Best, USA Today graphs,
quantity words, journalistic significance and
Interpreting doublespeak
Top 5: Howard Wainer (#3), percentage graphs
(#3), statistical doublespeak
(#3) and
Dennis Haack (#4)
Top 10: Statistical standardization (#6), percentage grammar (#8) and
Gerald Bracey
(#10)
|
Top 15: Percentage tables (#11), statistical reasoning (#12),
multivariate
thinking (#12), percent grammar (#12), confounder (#14) and
Lynn
Steen (#15)
Top 20: Confounding (#20)
The StatLit.org web site was not in the top 20 web sites returned by Google when searching for Paulos,
Gigerenzer, Simpson paradox, standardizing, quantitative
literacy, numeracy, statistical education, statistical paradoxes or social
construction. The StatLit.org web site ranks #1 for Simpson
paradox standardizing, #3 for social construction
statistics
and
#14 for Milo Schield. Schield's Augsburg site was #1 for
"chance grammar."
|


 NNN@Wingspread
 Teaching
Hypothetical Thinking
Teaching
Hypothetical Thinking
 Teaching
Social Justice
Teaching
Social Justice Teacher Guide to Data Discovery


