|
StatLit News
2009 |
-
Assess and Grade: AACU develops
Quantitative Literacy rubric. Australia (ABS) creates Statistical
Literacy competencies by grade.
-
NNN's journal Numeracy
in its second year with articles by Joel Best, Bernie Madison
(NNN) and David Bressoud (Macalester).
-
StatLit.org Grows: Visits
up 28%, downloads up 73% and domain referrals up 47%. 2009 Totals: 132,000
visits, 184,000 downloads and 40,000 domain referrals. Google-ranked as the
#1 site for "statistical literacy" for the 5th consecutive year.
-
Sad News: Gerald Bracey, "one of
the most erudite, prolific and acidic critics of national education
policy", dies at age 69.
|
|
|
NUMERACY
(NNN) JOURNAL |
Numeracy is an open-access, peer-reviewed
journal launched in 2008. Numeracy aims to support
education at all levels that integrates quantitative skills across
disciplines. The journal seeks evidence-based articles. See Vacher's
NECQL and
PKAL presentations. |
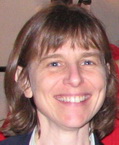
Len Vacher (left) and Dorothy Wallace (right)
are editors of Numeracy: Advancing Education in Quantitative
Literacy published by the National
Numeracy Network, supported by U. of S. Florida Libraries and hosted
by
the Berkeley Electronic Press™. |
|
|
|
QR/QL
GRANTS & CAMPAIGNS |
|
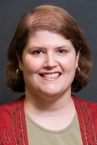
"Making the most of system data" by Dr Robyn
Pierce (left) and
Dr
Helen Chick. Goal: "to
classify the statistical literacy teachers need to gain value from
reports, and ... ascertain ... the perceptions that
... pose barriers to teachers..." See
The Statistical Literacy They Need to Interpret School Assessment Data
and
Teacher's Beliefs and Views about Statistics Education. |
 Math
you need when needed Math
you need when needed
NSF
awarded Phase 2 grants, 'The
Math You Need , When You Need It,' for "resources that introduce quantitative skills into
intro geo-science courses to increase the quantitative literacy of students."
One was $283,129 to Highline Community College. Eric Baer is the PI.
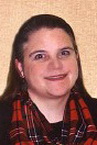
A
second was $218,438 to the U. of Wis-Oshkosh.
Jennifer Wenner
(right) is the PI. |
|
Karen Briggs, Associated
Professor of Mathematics at North Georgia State, received a $1,000 grant to
fund a statistical literacy project: Identifying and Evaluating
Statistics Found in Popular Media. The course will "require
students to evaluate the validity of statistical arguments that appear
in current popular media articles."
Grant proposal. |
 RSS
Ten Year StatLit Campaign RSS
Ten Year StatLit Campaign
The Royal Statistical Society (RSS) is planning "a 10-year (2010- 2020) campaign which will focus on raising the statistical
literacy of society as a whole: students and teachers ..., employees and
employers, from government ... to business, and a wide range of users
... including a strong focus on the citizen user, and the media."
Dr. David Hand (right) is President. |
AACU: QL ASSESSMENT |
|
AACU issues VALUE: Valid Assessment of
Learning in Undergraduate Education) rubrics. Quantitative
Literacy (QL) – also known as Numeracy or Quantitative Reasoning (QR) –
is a "habit of mind," competency, and comfort in working with numerical
data. Individuals with strong QL skills possess the ability to reason
and solve quantitative problems from a wide array of authentic contexts
and everyday life situations. They understand and can create
sophisticated arguments supported by quantitative evidence and they can
clearly communicate those arguments in a variety of formats (using
words, tables, graphs, mathematical equations, etc., as appropriate."
"Virtually all of today’s students, regardless of career choice, will
need basic QL skills such as the ability to draw information from
charts, graphs, and geometric figures, and the ability to accurately
complete straightforward estimations and calculations." |
  The
team that developed the
AACU Quantitative
Literacy Rubric included Nathan Grawe (left), Co-director of
the QuirK Project at Carleton College,
and Corri Taylor (right), President of the National Numeracy Network (Wellesley College).
Other members included Joan Hawthorne, Assistant
Provost for Assessment and Achievement (Univ. of North Dakota),
Michael Burke and
Jean
Mach English (College of San Mateo), and
Rolf Enger ( Author of
Vision for
Tomorrow: Preparing Leaders),
Richard
Hughes and Steven Jones, Director of Academic Assessment (US
Air Force Academy). The
team that developed the
AACU Quantitative
Literacy Rubric included Nathan Grawe (left), Co-director of
the QuirK Project at Carleton College,
and Corri Taylor (right), President of the National Numeracy Network (Wellesley College).
Other members included Joan Hawthorne, Assistant
Provost for Assessment and Achievement (Univ. of North Dakota),
Michael Burke and
Jean
Mach English (College of San Mateo), and
Rolf Enger ( Author of
Vision for
Tomorrow: Preparing Leaders),
Richard
Hughes and Steven Jones, Director of Academic Assessment (US
Air Force Academy). |
|
Interpretation: "Ability to explain
information presented in mathematical forms (e.g., equations, graphs,
diagrams, tables, words)." Representation: "Ability to
convert relevant information into various mathematical forms (e.g.,
equations, graphs, diagrams, tables, words)." Application / Analysis:
"Ability to make
judgments and draw appropriate conclusions based on the quantitative
analysis of data, while recognizing the limits of this analysis." |
Communication:
"Expressing quantitative evidence in support of the argument or purpose
of the work (in terms of what evidence is used and how it is formatted,
presented, and contextualized)."
Assumptions: "Ability to make and evaluate important assumptions
in estimation, modeling, and data analysis." [Ed., Assumptions can
include Joel Best's
focus on the social construction of statistics ]
Calculation [Self-explanatory]. |
STATISTICAL LITERACY COMPETENCIES |
|
The ABS Statistical Education Unit led by Gai Mooney, reviewed the
literature to define statistical literacy. From this four criteria were
identified: (1) Data awareness. (2) The ability to understand
statistical concepts. (3) The ability to analyse, interpret and evaluate
statistical information. (4) The ability to communicate
statistical information and understandings. |
The
Australian Bureau of Statistics Education page presents the the form
of each competency for various grades in primary and secondary school.
For the Data Awareness competency, primary students were expected to
read the data, junior secondary (intermediate) were expected to read
between the data and senior secondary were expected to read beyond the
data. [Ed. This template is well worth detailed
examination.] |
NEW BOOKS: GENERAL INTEREST |
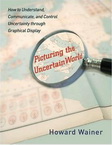 Picturing
the Uncertain World Picturing
the Uncertain World
How to Understand,
Communicate, and Control Uncertainty through Graphical Display
by
Howard Wainer. Product description: "an extraordinary
graphical adventure, revealing how the visual communication of data
offers answers to vexing questions yet also highlights the measure of
uncertainty in almost everything we do." See his
other graph-based books. |
Now You See It: Simple Visualization Techniques for Quantitative
Analysis by Stephen Few. "this manual features graphs and practical
analytical techniques that can be applied to a broad range of data
analysis tools. This approach is particularly valuable to those who need
to make sense of quantitative business data by discerning meaningful
patterns, trends ..." |
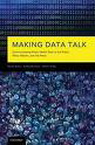 Making
Data Talk Making
Data Talk
Making Data Talk: Communicating Public Health Data to the Public,
Policy Makers, and the Press by David Nelson, Bradford Hesse and
Robert Croyle. Aim: "to summarize and synthesize research on the
selection and presentation of data pertinent to public health, and to
provide practical suggestions ... on how scientists ... can better
communicate data." |
Practical Rules for Graphic Presentation of Business
Statistics (Classic Reprint 1946) by Louis
Smart. "The functions of charts arc manifold. However, important
functions are: (i) to intrigue the imagination of the reader ... and (2)
to emphasize significant relationships because of their importance,
since oftentimes these ... are lost in the multitude of figures in the
table." |
|
Sway: The Irresistible Pull of Irrational Behavior by Ori and Rom
Brafman. "Sway, the submerged mental drives that undermine
rational action, from the desire to avoid loss to a failure to consider
all the evidence or to perceive a person or situation beyond the initial
impression and the reluctance to alter a plan that isn't working."
|
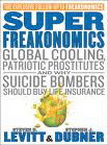
SuperFreakonomics: Global Cooling, Patriotic Prostitutes, and Why
Suicide Bombers Should Buy Life Insurance by Levitt and Dubner.
Asks not only the tough questions, but the unexpected ones: What's more
dangerous, driving drunk or walking drunk? Why is chemotherapy
prescribed so often if it's so ineffective? Can a sex change boost your
salary? |
|
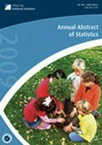
Annual Abstract of Statistics 2009
by the National Office of Statistics [UK]. "A statistical encyclopaedia
including over 10,000 series of data and covering key aspects of the
UK's economic, social and industrial life. The data are presented in
easy-to-read tables and supported by notes." |
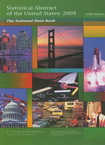
New tables include Retail Prescription Drug Sales.
Selected Notifiable Diseases, Alternative Fueled Vehicles and Vehicle
Fuels, and Participation in Selected Sports Activities.
The Statistical Abstract of the United States, published since 1878,
is the authoritative and comprehensive summary of statistics for the
United States. |
NEW BOOKS: PROFESSIONAL INTEREST |
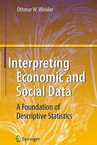 Interpreting
Economic-Social Data Interpreting
Economic-Social Data
Interpreting Economic and Social Data: A Foundation of Descriptive
Statistics (2009) by Othmar Winkler.
"Statisticians accept as a self evident principle that there is one
general theory of statistics that applies equally to all fields,....
Yet, important applications in economics and the social sciences in
general are not covered by what today is considered 'the theory of
statistics.' " |
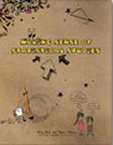 Making
Sense of Stat Studies Making
Sense of Stat Studies
Making Sense of Statistical Studies (MSSS, ASA) by Roxy Peck,
Daren Starnes, Henry Kranendonk, and June Morita. "15
investigations that align with recommendations from the NCTM Principles
and Standards for School Mathematics (PSSM, 2000) and the ASA–endorsed
publication: Guidelines for Assessment and Instruction in Statistics
(GAISE)." |
 A
Guide to Teaching Statistics A
Guide to Teaching Statistics
Michael Hulsizer and
Linda Woolf have co-authored the most comprehensive
review of the theory, research and practices related to the teaching of
statistics currently available. "Quantitative literacy is only a
small component of statistical literacy. Statistics is not branch of
mathematics but is rather a distinct discipline within the liberal
arts." website.
47 pages of references. |
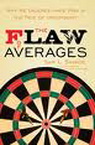 The
Flaw of Averages The
Flaw of Averages
The Flaw of Averages: Why We
Underestimate Risk in the Face of Uncertainty (2009)
by Sam L. Savage. "The Flaw of Averages also ensures that plans
based on averages of such uncertainties as customer demand, completion
time, and interest rate are below projection, behind schedule, and
beyond budget. In his book, Savage ... offer[s] an approach to curing
the Flaw of Averages." |
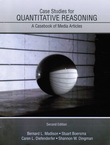 Case
Studies for QR (2nd Ed) Case
Studies for QR (2nd Ed)
Case Studies for Quantitative Reasoning (2nd ed.) by Madison,
Boersma, Diefenderfer and Dingman. A case book of news stories.
Topics: 1) Numbers and Quantities, 2) Percent and % change, 3)
Measurement and Indices, 4) Linear and Exponential growth, 5) Graphical
Interpretation and Production, and 6) Counting, Probability, Odds &
Risk. |
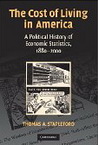
The Cost of Living in America: A Political History of
Economic Statistics, 1880-2000 by Thomas
Stapleford. "Stapleford has done a magnificent job taking us
inside the BLS to demonstrate the political and ideological structures,
in the government and out, that have so decisively framed the single
most important index generated by the American state." Nelson
Lichtenstein. |
|
Percentages
Percentages by Tom Knapp. Original available at
http://tomswebpage.net/
Topics: 1: The basics. 2: Interpreting percentages.
3: Percentages and probability. 4: Sample percentages vs.
population percentages. 5: Statistical inferences for differences
between percentages and ratios of percentages 6: Graphing
percentages. 7: Percentage overlap of two frequency distributions.
8: Dichotomizing continuous variables: Good idea or bad idea? 9:
Percentages and reliability. 10: Wrap-up. |
Reliability of Measuring
Instruments
Reliability of Measuring Instruments by Tom Knapp. Original
available at http://tomswebpage.net/
Topics: 1 What do we mean by the reliability of a measuring
instrument? 2 Measurement error. 3 Reliability theory
(abridged, with examples). 4 Attenuation. 5 The
interpretation of individual measurements. 6 The reliability of
difference scores. 7 reliability of a single item. 8
The internal consistency of multi-item tests. 9 Intraclass
correlations. 10 Two vexing problems. 11 Statistical
inferences regarding instrument reliability. 12 A very nice
real-data example. 13 Special topics. 14 The reliability of
claims. Appendices... |
|
Statistical Literacy in the Social
Sciences
Confronting Statistical Literacy in the
Undergraduate Social Science Curriculum by Wade and Goodfellow (2009).
Sociological Viewpoints; Fall 2009, Vol. 25, p75. Including
statistical literacy as a major subject in the undergraduate Social
Science Curriculum affirmed by the American Sociological Association
(ASA). Describes statistical literacy. Notes that literacy, mathematical
and statistical skills, context of knowledge, and critical questions
comprise the four knowledge elements. Includes the seven elements
defined by the National Council of Education & the Disciplines which
characterize QL. [Not publicly accessible] |
Think Twice: Harnessing the Power of Counterintuition by M. J.
Mauboussin. Shows that a "majority of decisions—no matter how good
the intentions ... —are mismanaged, resulting in a huge toll on
organizations, the people they employ, and even the people they serve."
"we often fall victim to simplified routines that prevent us from
coping with complex realities" |
|
The Numbers Guy: 2009 |
 Carl
Bialik Carl
Bialik
Carl Bialik, the Wall Street Journal "Numbers
Guy," went prolific with more than
40 articles in 2009
compared to 24
in 2008, 11 in 2007 and 23 in 2006. He co-writes The Daily Fix, a sports column
that appears each weekday morning on WSJ.com. Carl has a degree in
mathematics and physics from Yale University. Check out
his WSJ blog. |
Simpson's Paradox & Unemployment
The US unemployment rate is higher today for school
dropouts and for college grads than in 1980. But US unemployment
is lower today (10.2%) than in 1980 (10.8%).
How is this possible? Cari Tuni researched this paradox
in her 12/09/2009 WSJ article:
Good Data and Flawed Conclusions.
She argues that "in a statistical anomaly dubbed Simpson's Paradox,
aggregated numbers obscure trends in the job market, medicine and
baseball." [Note the graph.] |
|
|
|
Corri
Taylor, President, convened the 2009 meeting of the National
Numeracy Network (NNN) at the Univ. of Washington, Bothell.
Ellen Peters
(Bates) gave the keynote: Numeracy and Decision Making.
Talks
included:
Andrew Miller (Belmont Univ): A Problem-Based, Service-Learning
Approach to Financial Literacy
6up.
Hillyard, Nye
and
Krishnamurthy (UW-Bothell): Risky Financial Behavior.
|
More talks:
Suzie
Garfield: Stories That Count.
Neil Lutsky (Carleton): Say It with Numbers: The Persuasive
Powers of QR.
Aaron Montgomery
(Central Washington): Right Strategy, Wrong Game 6up.
Peter Littig (UW-Bothell): Playing Games in the Classroom: QR
Lessons from Nash, Newcomb, and Schelling.
Robert
Turner (UW-Bothell): Climate Change
Comparison Mapping Project.
Maura Mast (UMass-Boston)
Solving Real Problems Using Complicated, Confusing, Contradictory,
Messy, Difficult Information.
Milo Schield
(Augsburg)
Speculative Statistics and Public
Policy
6up. |
|
|
|
Len Vacher, co-editor of Numeracy,
and Todd Chavez, U. Florida Librarian, reviewed the literature in the
web of science on health literacy. They found found 10 assessment
instruments from which they compiled a total of 48 assessment items.
"Probability (risk) accounts for half of the questions. These questions
are heavy on ratios" A must-read for anyone interested in assessing
numeracy. |
Maura Mast reviewed Schield's "QL and School
Mathematics." Schield recommended offering QL or Statistical
Literacy along side Algebra II. Mast said, "This is an excellent
suggestion and is perhaps the most practical way to bring QL into the
pre-college curriculum. Such a course is ideal for students who are not
planning to go into a quantitative-based major in college..." |
QL: JMM and MATHFEST |
|
Numeracy: Assessing Basic Skills and Knowledge by Milo Schield,
Augsburg. Colleges need to assess the numeracy in their students.
Identifying the associated skills is a requirement for any grounded
attempt at assessment. To provide content validity, those skills and
competencies must be validated by subject-matter experts. A
process is proposed. Slides 6up |
Statistical Significance of Ranking Paradoxes by
Anna E. Bargagliotti (Univ.
Memphis, left) and
Raymond N.
Greenwell (Hofstra).
See
also Achieving Statistical Literacy in
Elementary School Using Current Popular Curricula.
Anna Bargagliotti, U. Memphis
Slides 6up.
|
 Math
Mistakes in the News Math
Mistakes in the News
Math Mistakes that Make the News by
Heather A. Lewis
(Nazareth College with a future student). In
2009, Heather taught Math 102: Thinking Mathematically. She
has collected some great stories on math mistakes that make news.
Most of her stories are written about in more detail in her positively
enchanting blog,
blog 360, along with stories from her family's everyday
contact with math. |
Betsy Darken, Univ. Tenn - Chattanooga, talked
on
Facing Up to the Realities of Quantitative Illiteracy. My
students need a "good grasp of multiplicative and proportional
relationships." What I aim for is basic number sense, technology
(calculator and Excel), money, multiplicative comparisons and
exponential change. See her
2007 May/June Focus
article (p.20) |
|
Using Media Articles to Drive a Q/L
Course
by Stuart Boersma (right), Caren Diefenderfer, Shannon Dingman and
Bernie Madison (left) Poster.
"The project includes making the course transportable, adaptable, and
more effective and creating assessments and scoring rubrics to both
measure learning in the course and to compare that learning to the
learning in two other courses." |
Medical Accuracy: Content for a
Quantitative Literacy Course. Stuart Boersma & Teri Willard, Central
Washington U. Slides
6up. Referral bias occurs when the positive and negative
referral rates differ. "When the two referral rates are equal, the
true sensitivity and specificity values will equal the apparent values.
There is no referral bias in this case." |
|
Toward a Numerate Culture: A QL Project.
D. Scott Dillery
(Lindsey
Wilson College) 1up. Scott
reported on a 2009 QL conference at the Emory & Henry campus sponsored
by the Mellon Foundation. Observations: multidisciplinary helps
buy in; common reading is good; Data Models “works”; inadequate
student support; less than expected faculty participation.
|
Maura Mast (right) is past
SIGMAA-QL chair. Talks:
QL from a Service Division Perspective. Gary T Franchy (Director
of General Education,
Davenport Univ.) Approach:
Use to the context of the programs to motivate & support the content of
our [math] courses. slides.
Mathematics & Democracy [Voting] by Kira Hamman, Penn State-Mont Alto
Slides 6up. |
|
Talks: Making Quantitative Reasoning
Central to a PreCalculus Course by Cinnamon Hillyard (left, NNN
President) and Nicole
Hoover
(U. Washington, Bothell)
Slides 6up.
Building mathematical & computational skills of science students by
Matthews, Goos and Adams, (U. Queensland)
6up. Incorporating QL into Research Writing. Kimberly Vincent (Washington
State). |
Posters:
Creating a Rubric for
Graphing, Caren Diefenderfer (Hollins, right).
Encouraging Problem-Solving
the First Day, Mike Pinter (Belmont). Gather
specific student information on an index card, Alice Kaseberg.
I Don't
Teach Math. I Teach Students Math, S. Cederbloom (Mt Union). Life’s Expectations And
Requirements, Susan Beane (U. Houston) |
QL WORKSHOPS |
|
Thirteenth Annual Meeting of the Northeast
Consortium on Quantitative Literacy (NECQL) was held at Smith College on
Saturday March 28, 2009.
Neil Lutsky (left), Carleton College, presented Spreading Activation for
Quantitative Reasoning in a College Community: Themes for Variations.
Maura Mast (SIGMAA-QL) and Cori Taylor (NNN) also spoke. |
Bernie Madison delivered this talk as the keynote address at a
quantitative
literacy conference, Feb 12-13, 2009, hosted by the Ohio Resource Center (ORC) and the Ohio Mathematics and Science
Coalition (OMSC). See a
video (48 min)
of Bernie Madison's presentation. [Ed. This presentation is
why Bernie is such a popular speaker on quantitative literacy.] |
STAT LIT WORKSHOPS |
|
TEAM-Math (Transforming East Alabama
Mathematics) hosted
a presentation by Chris
Franklin (left) and Gary Kader. Franklin and Kader discussed "the
importance of statistical literacy as a means of interpreting
information delivered by media sources as well as the role numbers play
in governing our lives with regard to citizenship, family and
employment." |
University of Alberta Libraries hosted its
third Winter Institute on
Statistical Literacy for Librarians February 18-20, 2009. This
training event provided strategies and skills for finding, evaluating
and retrieving published statistics. Instructors: Chuck Humphrey
(Data Librarian Coordinator, right), Leah Vanderjagt, Lindsay Johnston
and Anna Bombak. |
|
MISC EVENTS |
|
Data for a Downturn Economy (June 9, 2009) for Librarians.
Moderator Dan Coyle (right), director of Market Planning, Statistical
and Business, LexisNexis, opened with a brief discussion on the history
and value of statistical literacy, citing authors John Allen Paulos and
Joel Best as two leaders of the recent movement to focus attention on
statistics education. |
Investigating a Hierarchy of Students' Interpretation of Graphs
by Kazuhiro Aoyama (Aichi University of Education, Japan).
Published in the International Electronic Journal of Mathematics
Education (IEJME). This paper presents a hierarchy of the graphical
interpretation component of statistical literacy. Five different
levels of interpretations of graphs were identified: Idiosyncratic,
Basic graph reading, Rational/Literal, Critical, and Hypothesising and
Modelling. |
|
Innovative Approaches to Turn Statistics into Knowledge. OECD,
Census Bureau & World Bank. in Washington DC.
Talks: Mike Pearson and David Spiegelhalter and
:
Visualizing Risk. Amanda Cox (New York Time):
New York Times Statistical charts. Irene Ros (IBM):
From Analysis to Creativity in Data Visualization. (continued) |
 Turn
Stats Into Knowledge Turn
Stats Into Knowledge
Anders & Britt Wallgren
(authors of Creating Better Charts): Statistically sound methods to turn time-series data into knowledge.
Jim Ridgway, James Nicholson, Sean
McCusker
Free statistics from statics: Empowering Individuals for Well Being &
Social Progress. |
|
STATLIT BLOGS |
|
The latest data shows total consumer credit collapsing at an
accelerating rate. The differences between the four graphs with the same
underlying data but differing in what they do or don't take into account
and whether they show the actual number or the change in that number.
Blog: Junk Charts: Recycling Chart-Junk as Junk Art. |
"Fact: Federal employees make more on average than private-sector
employees." But the BigBang Economics blogger asserts, they are "not
overpaid after taking into account lurking variables such as full-time
employment, education and age." Is this another instance of Simpson's
Paradox? Blog:
Big-Bang Economics (2009/10) |
|
New Statistical Literacy blog. Statistical illiteracy is all-too-common in
our modern society -- a world drenched with data that is reported by
statistical illiterates and statistically-opportunistic hucksters. . Now there
is a blog dedicated to spotting statistical illiteracy. [Note: The
StatLit blogger is also the web-master for this site]. Year-to-date
Stats: (12/14): Visitors 336 and Visits 1,758. Most popular blogs:
SAT scores Tell us
Zip.
AP
Creates Bogus Crime Wave. (See right) |
"Of the children who ate candies or
chocolates daily at age 10, 69 percent were later arrested for a violent
offense by the age of 34." This statistic was created by the
Associated Press (AP). The StatLitBlog was the first to note the
statistic was bogus. The AP
committed the fallacy of the inverse. The correct statistic was "69% of
respondents who were violent by the age of 34 years reported that they
ate confectionary nearly every day during childhood." |
|
GENERAL NEWS |
|
Statistical literacy is defined as "the
ability to read and interpret statistics, and think critically about
arguments that use statistics as evidence" in the
UN
Development Dictionary. [Use the slider under "S"] The United
Nations Development Programme (UNDP) "works to
improve statistical literacy among users of data on poverty, the MDGs
and human development. The organization develops the capacity of
government, civil society and the media by producing courses on
statistical literacy and organizing training workshops." |
Statistical literacy is defined as "the
ability to accurately understand, interpret and evaluate the data that
inform these issues." "In order to make sound judgements,
it is essential that we are equipped with the very best knowledge for
research, planning and decision-making purposes. While it may be the
issues rather than the statistics that grab people's attention, it
should be recognised that it is the statistics that inform the issues."
"In today's information-rich society, being statistically literate will
give you an edge." |
|
The RSS Centre for Statistical Education (RSSCSE)
relocates to Plymouth. Inauguration talks on 16 November 2009 included
Teaching and Learning Risk in
Schools by Pratt, Kent, Levinson, Kapadia & Yogui.
Video
of talk by RSSCSE Director Neville Davies. |
"Every interesting problem in health, crime, poverty, environment,
education, personal well being…is multivariate, has non-linear
relationships, has confounding variables ... We don’t teach these things
in school, but perhaps we should!"
James
Nicholson, Consultant to the SMART Centre, University of Durham.
|
|
The RSSCSE produced an interesting
graphic indicating different levels of statistical awareness
depending on whether one is a statistical consumer or a statistical
producer. |
Oct 9, 2009, ICPSR held on online panel discussion on
QL: Assessment and Enhancement. Panel: Flora McMartin, Broad-Based Knowledge; Corrine Taylor, Wellesley College. Slides
WMV 70mb, MP3 20mb |
DD4D – Data Designed for Decisions.
Paris.
June 18-20, 2009: Enhancing
social, economic and environmental progress. 1) Finding
the Story In this session we will explore how the story begins.
Those who research, who explore, who document and collect. And who can
see the bigger picture. They are the first link in the chain of
communication and understanding. 2) Telling the Story: A
classic topic for all those who visualise and communicate data. DD4D
will also look beyond visual representation at the connection with the
main storytellers of our age, the media.
3) Living the Story: This is where we find out whether and how
the story is working for the user. How people use and interact with
data, how it can support groups and individuals to make decisions.
|
A conference for intermediaries between
data, knowledge and empowerment. We will investigate selection,
visualisation, interpretation and communication of data, and how it can
be effectively used to: (a) help understand complex issues, (b) make
data relevant at a personal level, (c) close the gap between objective
measurement and perception, and (d) take decisions based on evidence.
Participants should expect to leave with insights into their own subject
area, a look beyond the usual boundaries of discipline, and new
unexpected alliances.
The DD4D programme committee:
Jorge Frascara, Enrico Giovannini, Helmut Langer, David Sless, Patricia
Wright and Richard Saul Wurman. |
|
Adult Learning Mathematics: ALM |
|
Assessing Quantitative Skills (p. 251) by O’Donoghue & Van der
Kooij. Aim: "to assess a range of ‘quantitative knowledge and skills’
suitable for workers.
Integrating Numeracy
across the curriculum by Kathleen Crammer (p. 111).
|
Three bridging
course preparing students for the mathematical demands of tertiary study
(p. 299) by Gillies et al.
Definitions
of Numeracy as presented by ALM members during conferences in the
past ten years in Appendix 4. [Perhaps a hundred statements or
definitions.]
|
NEW WEB SITES |
|
Gapminder:
Unveiling the beauty of statistics for a fact based world view.
Explore the world. See myths get demolished. Explore gaps within
countries. Videos that debunk myths about Bangladesh, CO2
emissions, urbanization and more. This software unveils the beauty
of statistical time series by converting boring numbers into enjoyable,
animated and interactive graphics. Co-founded by Hans Rosling:
"the man who brought sexy back to statistics."
|
Hans Rosling, founder of GapMinder was
asked about statistical education. In the video he replied: "the ability to play computer games and the ability
to develop interesting tools in Flash can now be used in schools. But an obstacle is that many schools block the downloading and
installing of Flash readers. Let there be Flash in
schools and statistics will be fun."
|
|
2009/10: Australia's Bureau of
Statistics (ABS) introduces 'Understanding Statistics:' a central
repository for all information, resources and learning materials for
understanding statistical information and accessing, analysing and using
the range of data that is available on the ABS website. |
From Google UK (Media Consumption): "20 hours of
video are uploaded to YouTube every minute" (YouTube: 5/09). "5%
of all time online is spent on Facebook" (Comscore, 4/09).
"In mid-2008, social networking accounted for around 10% of world-wide
online time. This is a category that didn't exist 3 years ago."
(Nielsen, 5/09) |
2009 ARTICLES/REPORTS |
|
 Numbers
in Everyday Life Numbers
in Everyday Life
Amstat News presented a statistical literacy course taught by Hahn
[left], Doganaksoy,
Lewis, Oppenlander and Schmee. "Building a statistically literate
society is unquestionably one of our profession's major responsibilities
and challenges ..." Take-Aways: "Appreciate [the]
limitations of observational studies and differentiate correlation from
causation." |
Also available for this unique
statistical literacy course is the
longer original draft of
the Amstat News article, the
opening presentation by
Hahn, the
Schmee class on polls,
the Lewis class on Medical &
Health studies, the
Doganaksoy class on statistics in business, the Hahn wrap up class,
and the Hahn
class summary and reading list. The
version of the Amstat News published by the ASA is easier to read,
but the text cannot be copied. The
OCR version is harder to read but can be copied.
|
|
Statistical Literacy:
Wheat vs. Chaff
Statistical Literacy Knowing
What's Wheat and What's Chaff by
Chase Brady. Dated June 15,
2008, Univ. West Virginia at Parkersburg. Distinguishes two types
of statistical literacy: 1) familiarity with the terminology and methods
of statistics. 2) ability to discriminate between reliable statistical
information and not-so-reliable information. Brady uses the
second, newer meaning. |
What is Quantitative Literacy? "Statistical literacy,
quantitative literacy, numeracy -- Under the hood, it is what do we want
people to be able to do: Read tables and graphs and understand English
statements that have numbers in them." Milo Schield.
Test your Quantitative Literacy |
|
 Statistical
Literacy Guide Statistical
Literacy Guide
How to spot spin and inappropriate statistics by Paul Bolton
(2009), UK House of Commons Librarian. "The three essential
questions to ask yourself when looking at statistics are: Compared to
what? Since when? Says who?" See
Samples and Sampling,
Confidence Intervals and Statistical Significance,
Regression and
Charts. [Links broken] |
A
Math Paradox: The Widening Gap Between High School and College Math
by Joe Ganem: APS News 10/2009. The paradox: more school math sooner;
more college students in remedial math. Why? Ganem's
answers: 1. Confusing difficulty with rigor. 2 Mistaking process
[calculation] for understanding. 3 Teaching concepts that are
developmentally inappropriate. |
|
CAUSE:
Webinars*
"Using Calibrated Peer Review in Statistics and Biology: A Coordinated
Statistical Literacy Project" with Ellen Gundlach & Nancy Palaez,
Purdue.
OTHER
A Simple Guide to Voodoo Statistics
by Ian Schagen Chief Research Analyst New
Zealand Ministry of Education (May 2008). |
"9
out of 10 Seniors Recommend This Freshman Seminar: Statistics in the
real world" with
Jo Hardin, Pomona
College. CAUSE Webinar: Students investigate the practical,
ethical, and philosophical issues raised by the use of statistics and
probabilistic thinking in realms such as politics, medicine, sports, the
law, and genetics. |
|
Quantifying quantitative literacy. Age heaping and the history of human
capital by Brian A'Hearn, Joerg Baten, and Dorothee Crayen London:
Centre for Economic Policy Research (2009). Published in the
Journal of Economic History. "We show that Western Europe had
already diverged from the east and reached high numeracy levels by 1600,
long before the rise of mass schooling or the onset of
industrialization." |
Which is bigger? 250 tonnes or 17%: A tale of salt.
Jane Watson
and Kim Beswick. The potential for Numeracy across the Curriculum is
illustrated. Based on a newspaper article about salt in
the Australian diet, two avenues of investigation are suggested. One explores the meaning of the numbers in the
article. The other involves data collection from a local
supermarket and the software TinkerPlots. |
|
Colin Carmichael (Univ. of New England, AU) authored "Development and
validation of the Statistical Literacy Interest Measure". This
paper "describes the development of an instrument designed to assess the
interest that middle school students (years 7 to 9) have towards
statistical literacy. In particular the paper presents a theoretical
framework for interest in statistical literacy which is subsequently
used as the basis for item development." Proceedings of the 3rd
Annual Postgraduate Research Conference Faculty of The
Professions University of New England Armidale NSW P. 35. |
Statistical Literacy: Essential Competency
"Statistical literacy an essential competency for both producers and
consumers of data" This is the title of a short article by Ronald Seifer,
PhD, professor in the Department of Psychiatry and Human Behavior, Brown
University and Director of Research, Bradley Hospital. He argued that
"Unfortunately, many consumers are not statistically literate. But even
more disappointing is how few producers of statistics are truly
literate." Brown University Child and Adolescent Behavior Letter (CABL).
July 2009 Vol. 25, No. 7. |
|
Sue Gordon and
Jackie Nicholas (Math Learning Centre, Univ Sydney) present "Using
examples to promote statistical literacy." This paper presents
"empirical data on why and how international university educators use
examples to teach statistics in service courses, based on recent
research" and "relate the empirical findings to this [Gal's] model."
|
By
Professor Xiao-Li Meng, Whipple V. N. Jones Professor of Statistics
and Department Chair, Harvard University. Discusses the Gen Ed
course EM 16:
Real-Life Statistics: Your Chance for Happiness (or Misery).
Amstat News Fall 2009 |
|
UK Statistical Publications |
|
Life: what is the chance that we are alone? by Mark Burchell.
Of weekly wages and the price of wheat—and soaring IQs [The life of
Henry Playfair] by Helen Joyce.
London murders: a predictable pattern? by David Spiegelhalter and
Arthur Barnett. 2008:
School league tables: what can they really tell us? by Harvey
Goldstein. "their publication should cease." |
What is Strong Correlation? by
Marcin Kozak (Warsaw University of Life Sciences, Poland).
"Interpretation of correlation is often based on rules of thumb ... to
help decide whether correlation is non-important, weak, strong or very
strong." "such rules of thumb may do more harm than good." |
|
2009 QUOTES:
Statistical Literacy |
|
STATISTICAL LITERACY
-
Statistical literacy is
"the ability to read and interpret statistics, and think critically
about arguments that use statistics as evidence."
United Nations
Development Programme dictionary.
-
Statistical Literacy is the "ability to discriminate between
reliable statistical information and not-so-reliable information."
Chase Brady,
Distinguishing Wheat from Chaff.
-
Statistical literacy can change lives, helping individuals make
better personal choices, recognize misleading advertisements and
public service messages, and develop a more relaxed attitude toward
their health. The dream of statistical literacy embodies the
Enlightenment ideal of people’s emergence from their self-imposed
immaturity. In Immanuel Kant’s words, “Dare to know!”. To boost statistical literacy, we also recommend introducing
young children to statistical thinking and teaching statistics in
school as a way of solving real-world predicaments rather than as a
purely mathematical discipline.
Knowing Your Chances: What Health Stats Really Mean by
Gigerenzer et al. in Scientific American (2009).
-
Statistical illiteracy is largely
caused by non-transparent framing of information. Gerd
Gigerenzer in Making sense of health statistics. Bulletin of the
World Health Organization, Aug 2009, Vol. 87 #8, p567-A.
-
A major stumbling block for presenting
sociological information to public officials and the general public
is the lack of statistical literacy. Jeffries, Handbook of
Public Sociology (2009, p. 286).
-
Statistical literacy, then, is the ability to accurately
understand, interpret and evaluate the data that inform these
[everyday] issues.
Australian Bureau of Statistics (March 2009).
-
Every college student who graduates without statistical literacy
these days has been sold a crummy education; statistical literacy is
indispensable for understanding what’s going on in the economy, in
science, in politics… and maybe even for understanding what’s going
on in the arts. [Irregular
Times Blog 3/14/09, Jim Cook]
-
As statistics become ever more
ubiquitous..., so it becomes even more essential that as citizens we
possess the statistical literacy to make informed judgments about
how to interpret them and how to decode their political purpose.
Exploring Data: An Introduction to Data Analysis by Jane Elliott and
Catherine Marsh. (2009, Introduction)
-
With the increasing emphasis on evidence-based decision making, and
the use of statistical graphics and information, statistical
literacy is becoming a very important aspect of literacy in
general. Today is World Literacy Day.
Sri Lanka
Daily News 8 Sept., 2009
-
I found it very easy and compelling to link statistical literacy
(and the implied understanding of risk) to the broader economic
collapse ... [in lobbying with US Congressional delegates and
staff] Jim Cochran, Louisiana. Amstat News October 2009, p.
36.
-
"Statistical literacy, quantitative
literacy, numeracy -- Under the hood, it is what do we want people
to be able to do: Read tables and graphs and understand English
statements that have numbers in them." Milo Schield in the
Washington Post on What is QL?
-
Every interesting problem in health, crime,
poverty, environment, education, personal well being… is multivariate,
has non-linear relationships, has confounding variables ... We don't
teach these things in school, but perhaps we should!" James
Nicholson,
RSSCSE open
-
Statistical illiteracy
among physicians causes over-treatment, overdiagnosis and increased
health care costs. It also affects patients, whose hopes can get
unnecessarily raised by the claims that they read in medication
advertisements. Statistical literacy should be taught in school
beginning in the primary grades.
Science
News Nov., 2008.
-
"It is a hidden secret
that some Government Statistical Offices are doing as much as or
more for Statistical Literacy of their countries than Academics,
Departments of Education and Statistical Societies. It is for this
reason that the ISLP asked the directors of some of the most
successful statistical literacy programs of government statistical
offices to explain how they do it."
Statistical Literacy: A Reader April 15, 2009 by Armin
Grossenbacher.
-
Statistical illiteracy (a) is common to patients, journalists and
physicians; (b) is created by nontransparent framing of information
that is sometimes an unintentional result of lack of understanding
but can also be a result of intentional efforts to manipulate or
persuade people; and (c) can have serious consequences for health.
Collective statistical illiteracy makes informed consent science
fiction. the dream of statistical literacy is of a broader
scope and is fundamental to a functioning democracy. It embodies the
Enlightenment ideal of people’s emergence from their self-imposed
immaturity. In Kant’s (1784) words, ‘‘Dare to know!’’
Helping Doctors and Patients Make Sense of Health Statistics in
Psychological Science in the Public Interest, Volume 8, Number 2
(November, 2007).
-
"across widely varying samples of health professionals, patients,
and policymakers, in all countries studied, statistical illiteracy
reigns supreme—often with catastrophic consequences for individual
and public health. The media function as enablers of this problem."
"Innumeracy ... is an enormous societal problem."
Statistical Literacy A Prerequisite for Evidence-Based Medicine
by John Monahan in Psychological Science, 2008.
QUANTITATIVE LITERACY:
-
QL supporters must do more than convince parents, teachers, school
boards, education schools and others of the necessity of teaching QL
at the pre-college level—we must argue nationally that a solid QL
ability is an important part of college- and work-readiness (perhaps
more important, for some students, than success in Algebra II).
Maura Mast,
Numeracy 2009
QUANTITATIVE REASONING:
STATISTICS:
-
Our course co-coordinator gently advised us that the use of the
word 'statistics' in the course title would be a turn-off.
Hahn et al, Amstat News, Feb 2009, p. 16.
-
Aspiring journalists should stop going to journalism programs and
go to some other kind of grad school. If I was studying today, I
would go get a master's in statistics, and maybe do a bunch of
accounting courses and then write from that perspective. I think
that's the way to survive. The role of the generalist is
diminishing. Journalism has to get smarter. Malcolm Gladwell,
Time interview. Oct 20, 2009
-
"for statistics to be used ... [they must] become known, available,
and understood by wider audiences." OECD talk in DC July 2009.
??
-
"let there be Flash in schools
and statistics will be fun" Hans Rosling, founder of
GapMinder
|
|
International
Statistical Literacy Project |
|
Reija Helenius (right) is the new Director of
the ISLP from 2009-2012 along with colleagues Dr Pedro Campos (Portugal)
and Dr Sharleen Forbes (New Zealand). "An ISLP advisory board will
assist us in our work. All of us aim to improve statistical literacy
worldwide." The Director has issued a call for ISLP country
representatives. |
"The Information Age demands the
teaching and learning of new skills in data management, information
processing and problem solving. There is a growing need for
statistically literate citizens able to interpret, analyze and challenge
statistical claims." "We also hope to encourage more teachers to
pursue statistical literacy for their students in school." Juana
Sanchez ISLP Director 2008-9) |
|
Statistics Education |
|
Experiences and expectations: The real
reason nobody likes stats by Kai Ruggeri (left), Martin Dempster,
Donncha Hanna and Carol Cleary. "fewer than half [of the psychology
students surveyed] were aware of the statistics portion of their
course." "Most students claimed to be incapable of converting numbers
from statistics into real-life meaning." |
International issues in education by Kai
Ruggeri (left), Carmen Díaz (right), Karl Kelley, Ilona Papousek, Martin
Dempster & Donncha Hanna. Explaining the variance: level of
confidence in their ability to master introductory statistics (49%),
academic level (16%), and failing to see the relevance (15%).
Earlier version. |
|
Critical
Numeracy Across the Curriculum |
|
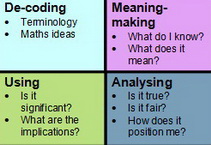
Jane Watson: "Critical Numeracy is
the ability to make discerning decisions about everyday issues that
involve mathematical concepts. We use newspaper articles as
starting points because they are a great source of current issues that
have relevance to students and their local communities. Articles often
quote numbers ...to present a case or a
particular point of view." |
This Model for Critical Numeracy can be used to ask "What sort of
thinking have we been doing?" Goal; "to build students' capacities
to ask questions about the meaning, validity and usefulness of texts
containing mathematical concepts or information" |
|
MERGA 2009:
Australasia |
|
Revealing Conceptions of Rate of Change by
Sandra Herbert
(left, University of Ballarat) and
Robyn Pierce (University of Melbourne).
Based on their analysis, rate can be thought of in five ways.
MERGA 2009 P. 217. [Ed. Their analysis of the relationship between these five different ways is
very thought-provoking.] |
Gender differences in middle school students’ interests in a
statistical literacy context. Colin Carmichael and Ian
Hay (University of Tasmania). Results indicated that girls were
more interested in aspects of statistical literacy that related to
surveys and boys were more interested in aspects relating to problem
solving and also contexts that are associated with sports. MERGA
2009 P. 89. |
|
Probing Teachers’ Pedagogical Content Knowledge in Statistics: “How
will Tom get to school tomorrow?” by Jane Watson, Rosemary
Callingham (right) and Erica Nathan MERGA 2009 P. 563. |
I, You and It: Pronouns and Students’ Understanding of Introductory
Algebra by Judith Falle (University of New England). "The
change in frequency of use of personal pronouns by students indicated a
change in their security of knowledge. A shift from the general
you to the more personal I, to the use of the vague it,
occurred as items became more difficult." MERGA 2009
P. 177. |
|
Statistical
Education Research Journal (SERJ) |
|
Factors Influencing the Development of Middle School Students'
Interest in Statistical Literacy by Colin Carmichael,
Rosemary
Callingham (left), Jane Watson and Ian Hay (all of Univ. of
Tasmania). The question: "what are the factors documented in the
literature that influence the positive development of middle school
students’ interest in statistical literacy?" |
Andrew Zieffler and
Joan Garfield
(U. Mn) presented Modeling the Growth of
Students' Covariational Reasoning During and Introductory Statistics
Course. Educators should "strive to understand
and improve students’ ability to reason with and understand
covariation." Bivariate reasoning scores increased from 10%
initially to 60% on the fourth try at course end. |
|
Castro Sotos, VanHoof, den Noortgate and Onghena authored
The Transitivity Misconception: the belief that given "positive
correlations between X and Y and Y and Z, the correlation between X and
Z will certainly be positive." "Almost half (49%) of the participants
showed evidence of this transitivity misconception." Those "showing
evidence of transitivity held a soft misconception more often than a
strong misconception." |
A Framework for Thinking about Informal
Statistical Inference by
Kattie Makar
(U. Queensland) and Andee Rubin (TERC). "three key
principles of informal inference: generalizations ‘beyond the data,’
probabilistic language, and data as evidence." Our goal is to "capture
the kind of informal inferential reasoning reported by Ben-Zvi and Sharett-Amir (2005)" |
|
English Language Learners in Introductory Statistics: Lessons Learned
from an Exploratory Case Study of Two Pre-Service Teachers by Larry
Lesser (left) and Matthew Winsor. Focus on understanding the
challenges of Spanish speaking English-language learners (pre-service
teachers) in statistics education. Notes the importance of context and
confusion among registers (subsets of language) |
Question Format and Representations: Do
Heuristics and Biases Apply to Statistics Students? by
Jennifer Kaplan (left) and Juan Du. An in-depth investigation of various
aspects of the "medical diagnosis problem": a two-stage conditional
probability problem. |
|
2009 ASA Journal of Statistical
Education (JSE) |
|
2008: The Effect of a Student-Designed Data Collection Project on
Attitudes Toward Statistics by Lisa Carnell (HighPoint
Univ.) One class of undergraduate statistics students [had] a
data-collection project that they themselves designed and implemented. A
second class, used as a control, did not have this option. "Both groups
showed a significant loss in interest during the course." |
Do
Hands-On Activities Increase Student Understanding? by
Thomas Pfaff (right) and
Aaron Weinberg
(Ithaca College). "Describes ... four hands-on activities." "Students
investigated the ... central limit theorem, confidence intervals and
hypothesis testing." "Despite our attempts...., their performance
on the assessments generally did not improve." |
|
Teaching Statistics in an Activity Encouraging Format by Sytse
Knypstra (University of Groningen, The Netherlands). Each group
had to perform certain tasks (e.g., explaining theory and/or solutions
of problems) and have separate regular meetings with the teacher.
Students report higher involvement and greater satisfaction in this
format than in the traditional format. |
How Much Math Do Students Need to Succeed in Business and Economics
Statistics? by
Green (left), Stone, Zegeye and Charles (Ball State Univ.). "Taking
more math credit hours, taking math courses that emphasize calculus, and
imposing a minimum grade of C- on the prerequisite math course have
significant positive impacts on student grade performance." |
|
Lexical Ambiguity in Statistics: What do
students know about the words association, average, confidence, random
and spread? Co-authored by Jennifer J. Kaplan (right, Michigan State Univ.),
Diane G. Fisher (Univ. of Louisiana - Lafayette) and Neal T. Rogness (Grand Valley State Univ.). Journal of
Statistics Education Volume 17, Number 3 (2009). |
The
Interplay Between Spoken Language and Informal Definitions of
Statistical Concepts Ilana Lavy and
Michal Mashiach-Eizenberg (The
Academic College of Emek Yezreel, Israel) "high percentage of
them failed to provide correct definitions of...statistical concepts."
"everyday use of the terms used ..., influenced the informal definitions
provided by the students." |
|
ASA JSM:
Statistical Literacy 2009 |
 Statistical
Literacy: 2009 Statistical
Literacy: 2009
Milo Schield (Augsburg College) chaired this 12th
JSM session on
statistical literacy with 130 attendees. He also organized a session on
Numeracy.
Milo presented
"Confound Those Speculative Statistics."
Speculative statistics -- model-based statistics -- are
indistinguishable from those with real counts and measures but are
susceptible to confounding.
6up |
presented by Stephen Ziliak (right)
and co-authored with Deidre McCloskey. Their thesis: "Statistical
significance at the 5% or other arbitrary level is neither necessary nor
sufficient for proving discovery of a scientific or commercially
relevant result." To wit, "a finding of “statistical” significance
... is, on its own, valueless, a meaningless parlor game." 6up 4up |
|
Ronald R Gauch (Marist College)
presented
Statistical Challenges in Medical Research: What Consumers Need to
Know. Clinical trials are the gold standard for using
statistical associations as evidence for causal connections. 6up
Ron presents 10 kinds of weakness in clinical trials that can
undercut these causal conclusions. [Ed. Students should know this.] |
Presented by
Rebecca Goldin
(George Mason University). "misrepresentations come from
misunderstanding: •The difference between causation and correlation •The
meaning of statistically significant •Orders of magnitude, and the
“prevalence” of a problem •Confounding factors •Relative risk versus
absolute risk •Margin of error •Importance of scientific consensus
6up |
Five
Other Slide Presentations
1) Telling the story to learn the
statistics 6up by
Bailer and
Campbell. 2) Know Your Chances: Curriculum to Help Students Be
Better Consumers of Statistics
2up (4.7mb) by Woloshin
and
Schwartz
3) Formal Debates to
Clarify the Objectives of an Intro Stats Course 4up by Dan Schafer (Author:
The Statistical Sleuth). Vaccination debate 1up
4) Designing Observational Studies
1up
Elizabeth Stuart (Johns Hopkins)
5) Statistical Literacy and Attitudes over two semesters
6up
Amy Phelps |
Presented by
Robert Raymond (right, Univ. of St. Thomas) and co-authored with Milo Schield. They analyzed 2,000 headlines of news articles involving numbers.
Of those titles with words describing an association, 61% involved action verbs like
'helps', 'ups'. 'cuts' and 'raises.' 4% used words
explicitly stating causation or association.
6up slides |
|
ASA JSM: Other 2009 |
|
Designing Curricula Supporting the
Development of Statistical Literacy by
Rochelle Tractenberg (Georgetown U. Med Ctr). "Statistical literacy
requires interpretation and evaluation of data ..., as well as
communicating ... conclusions and their support by the data."
(Continued) See
Tractenberg RE, McCarter RJ and Umans J. (2009): Assessment & Evaluation
in Higher Education. |
(Continued) "What are the SL-specific knowledge, skills,
and abilities (KSAs) to be obtained via the curriculum? • interpret
statistical information • critically evaluate statistical information •
critically evaluate data-related arguments • critically evaluate
stochastic phenomena • discuss reactions to statistical information •
communicate your understanding/the meaning of the information •
communicate concerns regarding the acceptability of given conclusions." |
|
ASA JSM: 2008 |
|
Survey of Attitudes Toward Statistics: An
Exploratory Look
by Marjorie Bond (left, Monmouth). Common Issues in
SATS Research by Candace Schau.
Students’
Attitudes Toward Statistics: Are there differences among various majors?
by Rebecca Pierce and Molly Jameson . [Editor: Assessing student
attitudes toward statistics is most critical.] |
Applying
Resampling to Analyze the Sensitivity of a Hypothesis Test to Confounding
by William Goodman
(University of Ontario Institute of Technology). Goodman notes
that "the analysis of potential bias by confounding “has never taken
root in basic statistics teaching and is hence uncommon” in many
important applications." |
|
USCOTS 2009 |
|
Jessica Utts presented
Seeing Through Statistics by Letting Go of
Math. "Many of our students who take introductory statistics come
away from the course able to compute a standard deviation, yet unable to
spot an egregious example of poor statistical reporting..." "we are
doing a poor job of educating the next generation. We can do better, but how
do we make the shift?" |
Dan Brick (left, Univ. St. Thomas) and Milo Schield
(Augsburg College) presented a
poster: Slightly
Radical Ideas to Help Students Interpret Introductory Statistics.
Five things to drop: All hand calculations; Most of probability
including independence; Binomial and normal approximation; T-test and
F-test tables, degrees of freedom, pooling; Chi-Square Test. (Students
need to understand the thought and computational process of inference
...). Add some controversial topics. |
NEW BOOKS: STATISTICS |
|
Focus in High School Mathematics: Statistics and Probability (pb)
by National Council of Teachers of Mathematics and Mike Shaughnessy.
"analyzing data sets, constructing and comparing representations of
data, and using samples and simulations." "They reason about
distributions...to make predictions, and determine the allowable scope
of conclusions." |
Essential Statistics (pb) by David Moore. "same highly successful approach and pedagogy of Moore’s
bestselling Basic Practice of Statistics, but
in a more concise format. [By] careful rewriting, he has
shortened and simplified explanations, to better highlight the key,
essential, statistical ideas and methods students need to know."
|
 Herkimer
and the Stat Pack Herkimer
and the Stat Pack
The Statistical Odyssey of Herkimer and the Stat Pack
by
Sanderson Smith. A story
about 10 students (the Stat Pack). They are serious students who
progress from introductory statistical concepts to sophisticated topics
such as inference and hypothesis testing." "Their leader is Herkimer, a
cartoon character who provides stimulating questions ... to enhance the
learning ..." |
 Quirky Way
Remember Stats Quirky Way
Remember Stats
The Hairy Larry Comics Collection 2007: The Quirky Way To Remember
Your Concepts For Elementary Statistics! by Larry Shrewsbury. "the
concepts are not only easier to learn, but are fun. All they have to do
is close their eyes and they can just "see" the quirky comics that
reminds them of the concepts they need for [their] Statistics Exam question."
|
|
What is a p-value anyway? 34 Stories to Help You Actually Understand
Statistics by Andrew Vickers. A fun introduction to ...
statistics, presenting the essential concepts in thirty-four brief...
stories. Vickers blends insightful explanations and humor, with minimal
math, to help readers understand and interpret the statistics they read
every day. |
 Introducing
Statistics Introducing
Statistics
Introducing Statistics: A Graphic Guide,
Eileen Magnello "Exploring the history, mathematics,
philosophy and practical use of statistics, this [book]
will be of interest to anyone perplexed by the jungle of numbers in
which we all live." See also
Lies, Damned Lies and Statistics: A Mathematical History and
Victorian Values: The Origin of Modern Statistics. |
|
The Concise Encyclopedia of Statistics edited by Yadolah Dodge.
"The aim has been to provide a short and concise encyclopaedia for those
who do not wish to purchase any of the several large or multi-volume
encyclopedias in the field. Practising statisticians,
particularly those teaching, will probably find this a useful reference
book... " John Goodier, Reference Reviews, Vol. 23 (2), 2009. |
The Pleasures of
Statistics: The Autobiography of Frederick Mosteller
(Paperback) by
Mosteller, Feinberg, Hoaglin and Tanur. "This volume is a companion to
Selected Papers of Frederick Mosteller (Springer, 2006) and A
Statistical Model: Frederick Mosteller’s Contributions to Statistics,
Science, and Public Policy (Springer-Verlag, 1990)." |
|
Statistics II for Dummies by Deborah Rumsey. "skills you
need to take on multiple regression, analysis of variance (ANOVA),
Chi-square tests, nonparametric procedures, and other key topics."
"provides plenty of test-taking strategies as well as real-world
applications that make data analysis a snap, whether you're in the
classroom or at work." |
Statistical Analysis with Excel For Dummies by Joseph Schmuller.
"Create graphs, develop estimates, and apply probability Get the scoop
on all of Excel's statistical tools and what they can do for you." "This
easy-to-follow guide explains statistics in plain English and shows you
how to .. make sense of it all — even if you're numerically
challenged!" |
|
Introduction to Probability and Its Applications (hc) by
Richard Schaeffer and Linda Young. "text focuses on the
utility of probability in solving real-world problems for students in a
one-semester calculus-based probability course. Theory is developed to a
practical degree and grounded in discussion of its practical uses in
solving real-world problems." |
Statistics for Health Care Professionals: Working with Excel
(2nd
ed.) by Veney, Kros and Rosenthal. Written in a clear, easily followed
style keyed to Excel 2007. Introduces the statistics applicable to
health administration, health policy, public health and other
professions, emphasizing the logic of probability and statistical
analysis in all areas." |
|
Common Errors in Statistics (and How to Avoid Them) (2nd ed., Pb)
by Good and Hardin. "a thorough and straightforward discussion of basic
statistical methods, presentations, approaches, and modeling
techniques." "Addresses popular mistakes often made in data collection
and provides an indispensable guide to accurate statistical analysis and
reporting. " |
 Stats
Through Apps (2nd) Stats
Through Apps (2nd)
Statistics Through Applications
by Dan Yates, Daren S. Starnes,
and David S. Moore. "The ideal alternative for juniors and seniors not
going into high level courses such as calculus, but who are interested
in an introduction to the important topics of statistics."
"Students ... focus on the statistical thinking behind data gathering
and interpretation." |
|
Web News
2009** |
13,000 Views in 2009: Graphs
Paper
May 16, 2007: Blogger John Walker said Schield's 2006 ASA paper,
Percentage
Graphs in USA Today, was "technical" but "pretty interesting." The
paper took off with over 8,000 viewings in 2007. Less were
expected in 2008. But in 2008 there were over 14,000 viewings for
to-date total of over 22,000. In one day (August 25th 2008), there
were more than a thousand viewings of this paper. Less was
expected in 2009. But in 2009 there were 13,253 views for a new
inception-to-date total of almost
36,000 views. Truly remarkable for such a technical paper. |
YouTube Videos (11/08)
Confidence (20,020): level (906), interval (64).
Statistics: (9,500): song (5,800), rap (803), math (560), lecture (106).
Significance (5,340): practical (293), level (243), statistical (97),
testing (94).
Hypothesis (1,710): test (183), testing (81), null (38)
Correlation (1,200): analysis (41), causation (20), coefficient (18),
Spurious (252), causation (249), Margin error (195), statistical
significance (12)
Mean, median (115): See
Mean, Median and
Mode: Cute! 86,157 views |
|
CARNEGIE FOUNDATION: STATISTICS PATHWAY |
|
"On some [community college] campuses, up to
90% of students test into this developmental mathematics sequence. Of
those who actually enroll in such courses success is elusive, with
course pass rates hovering around 50-60%. In California a
statewide study shows success rates in basic algebra of about 50%."
President Anthony S. Bryk |
To address the 70% failure rate in developmental math at community
colleges, the Carnegie Foundation is "developing an integrated pathway
to and through statistics."
The traditional requirements "do not serve well the vast majority
of community college students."
Bernadine Chuck Fong has been named a
Senior Partner to lead this developmental math initiative. |
|
"Statistics, data analysis and quantitative
reasoning are not only essential for a growing number of occupations and
professions, they are the mathematics needed for making decisions under
conditions of uncertainty, an inescapable condition of modern life."
"This is not a course- or curricular-design
project, however—or not only that. This is a field-building movement
that will engage practitioners, researchers, design / developers,
institutional leaders and policy makers ... in ways that fundamentally
challenge and change the character of developmental mathematics." |
What Community College Developmental
Mathematics Students Understand about Mathematics by
Stigler, Givvin
and Thompson (UCLA). Thesis: "substantive improvements in mathematics
learning will not occur unless we can succeed in transforming the way
mathematics is taught." Thesis: "students who have failed to learn
mathematics in a deep and lasting way up to this point might be able to
do so if we can convince them, first, that mathematics makes sense, and
then provide them with the tools and opportunities to think and reason."
See also
Developmental Math: The Problem. |
|
OTHER JOURNAL ARTICLES |
|
Assess Numeracy in Addition to Written and Verbal Skills. Letter by Matt
Griffiths. Nursing Standard; 12/2/2009, Vol. 24 Issue 13,
p33-33.
Do Parents Understand Growth Charts? by Ben-Joseph, Dowshen and
lzenberg. Pediatrics; Oct 2009, Vol. 124 Issue 4,
p1100-1109. 16% could not identify a child's weight, 32% could not
identify the percentile of a point and 44% could not define a
percentile.
Numbers Don't Lie, but Do They Tell the Whole Story? by Schillinger and
Sarkar. Diabetes Care; Sep 2009, Vol. 32 Issue 9,
p1745-1747.
National numeracy tests: A graphic tells a thousand words. Lowrie &
Diezmann. Australian Journal of Education; Aug2009, V53 #2,
p141-158 |
The
Assessment of Quantitative Literacy at a Large Public Institution
by Yvette Nicole Johnson and Jennifer Kaplan
2008
CRUME.
Quantitative Media Literacy: Individual
Differences in Dealing with Numbers in the News by Dolf Zillmann,
Coy Callison and Rhonda Gibson. Media Psychology; Oct-Dec 2009, Vol. 12
Issue 4, p394-416
Quantifying Quantitative Literacy: Age Heaping and
the History of Human Capital. Authors: Biran A’Hearn, Jörg Baten and
Dorothee Crayen. Journal of Economic History; Sep 2009, Vol. 69
#3, 783-808. |
|
Journal Articles: Statistical Literacy
Confronting
Statistical Literacy in the Undergraduate Social Science Curriculum.
Sociological Viewpoints; Fall 2009, Vol. 25, p 75-90, 16p
Statistical literacy an essential competency for
both producers and consumers of data by Ronald Seifer, Brown
University Child & Adolescent Behavior Letter; Jul 2009, Vol. 25 Issue
7, p1-7.
Making sense of health statistics by Gerd Gigerenzer. Bulletin of the
World Health Organization, Aug 2009, Vol. 87 #8, p567-A.
"statistical illiteracy is largely caused by non-transparent framing of
information." |
Orchestrating Semiotic Leaps from Tacit to Cultural Quantitative
Reasoning. Dor Abrahamson. Source: Cognition & Instruction; 2009, Vol.
27 Issue 3, p175-224
Pictorial representations in statistical reasoning by Gary Brase.
Applied Cognitive Psychology; Apr2009, Vol. 23 Issue 3, p369-381.
Research shows that icons are better at communicating Bayesian
comparisons in medical tests (avoiding the confusion of the inverse)
than are Venn diagrams. |
NEW BOOKS: EPIDEMIOLOGY |
 Epidemiology 101: LEAP Epidemiology 101: LEAP
Epidemiology 101 (Essential Public Health) by Robert Friis.
"Designed to fulfill the four essential learning outcomes of Liberal
Education and America's Promise (LEAP) a campaign of the Association of
American Colleges and Universities (AACU), Epidemiology 101 meets the
needs of instructors teaching an overview or introductory course in
epidemiology." |
 Eras
of Ideas in Epidemiology Eras
of Ideas in Epidemiology
Eras in Epidemiology: The
Evolution of Ideas by Mervyn Susser and Zena Stein. Traces
"the evolution of epidemiological ideas from earliest times to the
present. Beginning with ... the dawn of observational methods, ...up to
the development of eco-epidemiology, which attempts to re-integrate the
fragmented fields as they currently exist."
|
|
A Clinician's Guide to Statistics and Epidemiology in Mental Health:
Measuring Truth and Uncertainty (Cambridge Medicine) (Pb) by
Ghaemi.
"Accessible and clinically relevant... describes statistical concepts in
plain English with minimal mathematical content. Perfect for the busy
health professional who wants to know which statistics to believe - and
why." |
 Design
of Observational Studies Design
of Observational Studies
Design of Observational Studies (Springer Series in Statistics)
(Hardcover) by Paul Rosenbaum. "both an introduction to statistical
inference in observational studies and a detailed discussion of the
principles that guide the design of observational studies." Reviews "ideas discussed in Rosenbaum’s Observational Studies in a
less technical fashion." |
|
Statistical Methods in Environmental Epidemiology
by Duncan
Thomas. "Environmental epidemiology is the study of the
environmental causes of disease in populations and how these risks vary
in relation to intensity and duration of exposure and other factors like
genetic susceptibility." Governmental safety standards and compensation
policies are based on it. |
Ethics and Epidemiology:
edited by Coughlin, Beauchamp and Weed. "successful and serious
addition to the discourse of public health ethics. Textbooks and
narrower treatises abound, but many suffer from a general thinness of
discussion and philosophical sophistication. This book provides rigorous
ethical analysis ... with an accessible writing style." |
NEW BOOKS: SOCIAL STATISTICS |
|
A Quantitative Tour of the Social Sciences
(Hardcover) Editors: Andrew Gelman and Jeronimo Cortina.
Includes chapters on History, Economics, Sociology, Political Science
and Psychology. Final chapter on Intent to treat: causal inference.
|
 Applying
Social Statistics: QR Applying
Social Statistics: QR
Applying Social Statistics:
Introduction to Quantitative Reasoning in Sociology
by Jay Weinstein. "Applying
statistical techniques in sociological research."
"In addition to the usual range of topics in descriptive and inductive
statistics, it...illustrates the close connection between sociological
theory and practice, on one hand, and quantitative reasoning, on the
other." |
 Quantitative
Data Analysis Quantitative
Data Analysis
Quantitative Data Analysis:
Doing Social Research to Test Ideas by Donald
Treiman. "this book doesn't just teach statistics-–it teaches how to use
statistics to answer questions about the social world. In simple
language, from simple percentage tables to fixed-effects models ..."
"packed with examples from real data." Paula England, professor of
sociology, Stanford. |
Introduction to Social Statistics: The Logic of
Statistical Reasoning by Thomas Deitz and
Linda Kalof. A basic statistics text with a focus on the use of
models for thinking through statistical problems. Focuses on answering
questions: Why do some US states have high homicide rates while in
others the occurrence of a homicide is very rare? |
|
Best Practices in Quantitative Methods
(pb): edited by Osborne. "Best practices in Measurement, Research
Design, Basics of Data Analysis, Quantitative Methods, and Advanced
Quantitative Methods. Each chapter contains a review of the literature,
a case for best practices in terms of method, outcomes, inferences,
etc., and broad-ranging examples."
Hc (2007). |
Research Methods for Everyday Life: Blending
Qualitative and Quantitative Approaches by
Scott VanderStoep and Deidre Johnson ." "fresh and engaging introduction
to the process of social research and the variety of research methods,
highlighting quantitative and qualitative methods and how to combine
them." |
|
Visible Learning: A Synthesis of Over 800 Meta-Analyses Relating to
Achievement by John Hattie. "This book is about using
evidence to build and defend a model of teaching and learning. A major
contribution is a fascinating benchmark/dashboard [effect size] for
comparing many innovations in teaching and schools." See also
What Works Best: a summary of the book. |
R |
NEW BOOKS: MATHEMATICS / SPORTS |
 Math
Explains Your World Math
Explains Your World
One Hundred Essential Things You Didn't Know You Didn't Know: Math
Explains Your World (Hardcover) by John Barrow. "the
mathematical ideas that offer insight into what makes the world turn
around. They crop up in everything from physics to politics and whet
one’s appetite for digging deeper. [He] directs one’s attention to
their larger significance..." (Steven Brams) |
 Impossible
(2008) Impossible
(2008)
Impossible?: Surprising Solutions to Counterintuitive Conundrums
(Hardcover) by Julian Havil. "A superb discussion of problems
easily understood by a high schooler, yet with solutions so
counterintuitive as to seem impossible. There are surprises on almost
every page." (Martin Gardner |
|
Practicing Sabermetrics: Putting the Science of Baseball
Statistics to Work (pb) by Gabriel Costa. "by
the authors of Understanding Sabermetrics (2008). ... How to
compare players across generations; how to account for the effects of
ballparks and rules changes; and how to measure the effectiveness of the
sacrifice bunt or the range of the Gold Glove-winning shortstop." |
Mathletics: How Gamblers, Managers, and Sports Enthusiasts Use
Mathematics in Baseball, Basketball, and Football. Brings "the
game alive through the fascinating mathematical questions he explores.
He gets inside professional sports like no other writer I know.
Mathletics is like a seat at courtside." (Marc Cuban, owner of the
Dallas Mavericks) |
|
"Concept Mapping in Mathematics: Research into Practice" is the
first comprehensive book on concept mapping in mathematics. How the
meta-cognitive tool, hierarchical concept maps, and the process of
concept mapping can be used innovatively and strategically to improve
planning, teaching, learning, and assessment at different educational
levels. |
How to Pass Data
Interpretation Tests: Unbeatable Practice for Numerical and Quantitative
Reasoning and Problem Solving Tests by Mike Bryon. "Data
interpretation tests are fast becoming the most common type of numerical
question in psychometric tests. At some point in their career many
people will have to pass one." |
|
ISI 57
IPMs: Durbin South Africa |
|
Invited Paper Meetings (IPM):
IPM 37: The roles of statistical agencies in developing statistical
literacy. Organized by Reija Helenius (Finland)
Improving
statistical literacy - Strategies and Experience of the Australian
Bureau of Statistics" Siu-Ming Tam & Nicola Cross. (Abstract)
Readability and Ease of Use of the Eurostat Internet. Schafer.
The role of
Statistics Portugal in developing statistical literacy" Pedro José
Campos, J. Pinto Martins (Abstract).
IPM 38: Educating the public on how to use official statistics.
Peter Wingfield-Digby (UK) organiser and chair.
Making Statistics
attractive through Partnerships with the Media, Ben Paul Mungyereza.
Making official data relevant to students:
Statistics Canada’s Education Outreach Programme Mary Townsend and
Art Ridgeway.
IPM41: Exploiting the Progress in
Statistical Graphics and Statistical Computing for the Benefit of
Statistical Literacy. Organiser and chair: Juana
Sanchez.
How to Avoid Some Common Graphical Mistakes, Naomi Robbins
Using R and GGobi to Enhance the Learning of
Multivariate Analysis and Data Mining, Dianne Cook (Abstract).
Wikis, Dynamic Charts, Videos and other Innovative Tools to
Transform Statistics into Knowledge, Enrico Giovannini
(Abstract). |
IPM 42: Survey Research in
Statistics Education. Organized
by Katie Makar (Australia). Chair: John
Harraway.
Did it Make a Difference? Evaluating
transformational Change in the Statistics Classroom, Paul Fields
(Abstract).
Methodological problems of survey
applications in statistics education Teaching statistics through surveys
- Experiences at the University of Southampton, Natalie Shlomo.
IPM 43: Research on Informal Inferential Reasoning. Organized
by Katie Makar (Australia). Chair: John
Harraway.
Cognitive Development of Informal Inferential Reasoning,
Chris Reading.
Insights into Informal Inferential Reasoning in the
Primary Classroom, Aisling Leavy.
Informal Inferential Reasoning
About Large Scientific Data Sets, James Hammerman.
IPM 44: Teaching, Learning and
Assessing Statistics Problem Solving in Higher Education.
Cognitive Issues of Assessment when
Teaching through Problem Solving, Penelope Bidgood and Neville Hunt.
Similarities and contrasts in learning
problem-solving in statistical data analysis and modeling, Helen
MacGillivray (Abstract).
The application of problem-based
learning to statistics education: a case study, Freeman et al.
(Abstract). |
|
ISI 57
STCPMs: Durbin South Africa |
|
Special Topic Contributed Paper Meetings (STCPMs):
STCPM 27: Interactive, data-driven and technology-enhanced approaches
for probability and statistics education
Curricula Quantitative and Qualitative Assessment of Technology-Enhanced
Probability and Statistics Education (Abstract) STCPM 57: Teaching
and Learning Resources using Census@School
Census At School
Resources from Canada Mary Townsend and Neville Davies
Relevant and Engaging
Statistics Resources from Census@School UK. Doreen Connor and
Neville Davies
|
Using CensusAtSchool as a
resource for statistics teaching in New Zealand classrooms (Abstract)
STCPM 71:
Statistically Significant Learning Experiences
Statistical Literacy
Competitions and Statistical Literacy. Juana Sanchez (Abstract)
Creating Significant Learning Experiences in Graduate Statistics Courses
through Statistical Literacy Assessments. Enriqueta Reston (Abstract)
Methods for Enhancing Student Learning of Statistics. Patrick
Murphy (Abstract)
Challenges: Significant Learning Experiences in Elementary and Secondary
Schools. Campos, and Olievera. (Portuguese?) |
|
ISI 57
CPMs: Durbin South Africa |
|
Contributed Paper Meetings (CPMs):
CPM 3: Statistics Education: Interactive Methods in Teaching. Evaluate Effectiveness of
Interactive Videoconferencing System and WEB Aided Course Repetition in
Medical Instruction
Interactive Exploration
of Statistical and Probabilistic Concepts in Algorithms
Perform statistical and
engineering analysis with the Excel Analysis ToolPak
The Effect of Using DVD
in Teaching First-Year Calculus at a Distance: The Use of the
Kolmogorov-Smirnov Test
Web materials for
Statistics Education via CAUSEweb
CPM 22: Statistics Education
Statistical Education
Analysis of the Malaysian Certificate of Education Statistics and
Probability Examination Questions
Constructing Similar, but
Different, Examinations
Global certification
exams integrated into graduate statistics courses
Statistics’ ‘next
top-models’: testing changes in attitudes toward statistics
The work in groups as a
motivator in Statistics classes
Using Assessments to Help
Students Learn |
CPM 88: Statistical
Education I
(In) Formal aspects of
Independent Events Abuse of Use and Teaching of Statistics in Eastern
Nigeria
Analysis of Statistics
content and results of the first national examination based on the South
African National Curriculum Statement (NCS)
Estimation of the
Sensitivity and Specificity of Qualitative Diagnostic Test Under Normal
Assumption
Gap Analysis of Employers
Expectation and Work Readiness of Graduating Mathematical Sciences
Students
The Challenges Faced in
Statistics Education in African Countries
CPM 89:
Statistical Education II
Changes in the Media Habits of College Students during the Last Five
Years and the Implications for Education
Influential Mathematicians:
Where do they Come from and Where do they Go?
On Measures for Resolving
Student's Misconceptions in Statistics in University of Lagos, Nigeria
Populations, Samples,
Measurement, Variables and Data: Pedagogically Undervalued Foundation
Slabs of Statistical Castles
Statistical Education of
Medical Students in Pavlov State Medical University |
PAST EVENTS IN 2009 |
-
Interpreting Economic and Social Data: A Foundation of Descriptive
Statistics. A
masterfully compelling argument on why statistical analysis in the
social sciences is essentially different from that in the physical
sciences. Winkler notes that many -- if not most -- of our
statistical ideas originated in the physical sciences where such
ideas as a fixed population parameter and a fixed relationship
between variables was often the norm and deviations are aptly
treated as error. But such ideas do not fit well in the social
sciences where the human condition seldom involves fixed population
parameters and more often than not lacks any fixed relationship
between variables. This book goes to the core of statistical
thinking. If you teach the use of statistics in a social
context, you should read this book and understand this argument.
-
Nov.
12-15, 2009.
AMATYC
35th Conference, Las Vegas, NV.
Amer. Mathematical Assoc. of Two-Year Colleges
Schield proposes "Statistical
Literacy: A New On-Line Gen Ed Course for Math Teachers."
Developing Q/L by Beaudrie and Boshmans (S79). QL:
Reaching and Teaching today's Students by Amick and Marshall (S93).
The Calendars of the Mayas by Cetepillan and Szymanski (S57).
Mathematical Heresy by Frank Weidenfeller (S63)
Top Ten Things
Students Have Trouble with in Statistics, Averbeck & Rumsey (W22).
Lessons from History of Mathematics, D. Bressoud (S78).
Structuring e-Portfolios in QR course, Suzanne Topp (S142).
Using Model-Elicting Activities to Teach Statistics, Robert delMas
(W28).
Structuring the Out-of-Class Experience in Introductory
Statistics by Roxy Peck (S145 and S122)
The
AMATYC
2008 survey (793 respondents): Of those answering the question,
64% agreed (450) that AMATYC should offer course work through an
accredited university over the Internet for faculty wanting to
update their skills or refresh their knowledge in certain areas.
Respondents requesting Internet courses through an accredited
university (450) were asked:
-
which
mathematical topics they wanted to learn more about.
teaching developmental mathematics (67%), history of mathematics
(58%), mathematics for teachers (50%), statistics (40%),
quantitative literacy (35%),
number theory (30%) and other (21%).
-
which
instructional techniques they wanted to learn more about.
active learning (77%), teaching in context (45%), using
classroom assessment for research (47%), quantitative
literacy (37%) and other (8%).
-
what
technology training they would be interested in.
teaching online coursework effectively (72%), mathematics
software (68%), calculator usage (39%), statistical software
(34%), Blackboard (30%) and other (8%).
-
Nov. 6-7, 2009.
SENCER Quantitative Reasoning Symposium, Saint Paul, MN.
Schedule
Metropolitan State University in Saint Paul, MN will be host to the
Midwest SENCER (Science Education for New Civic Engagements and
Responsibilities) Center of Innovation Fall Symposium on Teaching
Quantitative Reasoning through Civic Issues.
Evening plenary address by Professor Deborah Hughes Hallett:
What Can Statistics Tell Us?
Morning plenary address by Professor of Psychology Neil Lutsky
from Carleton College in Northfield, MN.
Talk by Milo Schield:
Science Literacy Requires Statistical Literacy.
6up slides. -
August 16-22, 2009.
57th
Session International Statistical Institute (ISI)
Durban. IASE Chair: Helen MacGillivray Program
IPM 37: The roles of statistical agencies in developing
statistical literacy. Organized by Reija Helenius (Finland)
"Improving statistical literacy - Strategies and Experience of the
Australian Bureau of Statistics" Siu-Ming Tam and Nicola Cross.
"The role of Statistics Portugal in developing statistical literacy"
Pedro José Campos, J. Pinto Martins.
IPM 38: Educating the public
on how to use official statistics. Tues, 9AM. Peter
Wingfield-Digby (UK) organiser and chair. "Making
Statistics attractive through Partnerships with the Media" Ben Paul
Mungyereza. "Improving Use of Official Statistics - How
Marketing and IT Help" Chun-Keung, Leo Yu. "Making official
data relevant to students: Statistics Canada’s Education Outreach
Programme" Mary Townsend and Art Ridgeway. Discussants: Davaasuren
Chultemjamts and Hilary Joffe.
IPM41: Exploiting the
Progress in Statistical Graphics and Statistical Computing for the
Benefit of Statistical Literacy. 15:30 Tuesday.
Organiser and chair: Juana Sanchez. Using R and GGobi to
Enhance the Learning of Multivariate Analysis and Data Mining,
Dianne Cook. Wikis, Dynamic Charts, Videos and other
Innovative Tools to Transform Statistics into Knowledge, Enrico
Giovannini. How to Avoid Some Common
Graphical Mistakes, Naomi Robbins
IPM 43: Research on Informal
Inferential Reasoning. Tues, 13:00 Tues. Organized by Katie Makar
(Australia). Chair: John Harraway. Cognitive Development of Informal
Inferential Reasoning, Chris Reading. Insights into Informal
Inferential Reasoning in the Primary Classroom, Aisling Leavy.
Informal Inferential Reasoning About Large Scientific Data Sets,
James K L Hammerman. Discussant: Jim Ridgeway -
August 14-15, 2009.
IASE Satellite Roundtable: "The Next Steps in Statistical
Education" Durban.
Program.
Conference Committee: Patrick Murphy, Ireland (Chair and
Joint Chief Editor, European Representative), Allan Rossman USA,
Larry Weldon Canada (Joint Chief Editor and CD Writer), Richard
Wilson Australia, Enriqueta Reston Philippines, and M.
Alejandro Sorto Latin America-
August 6-8, 2009.
MathFest, Portland
Oregon.
Short Course: A Game Theory Path to Quantitative
Literacy by David Housman (Goshen College) and Rick Gillman
(Valparaiso University)-
August
6-10, 2009.
Sencer
2009 Summer Institute, Chicago IL.
"The
National Center for Science and
Civic Engagement invites applications to participate in the 2009
SENCER Summer Institute, planned for August 6-10th in Chicago and
hosted by Harold Washington College.
SENCER (Science Education for
New Civic Engagements and Responsibilities) is a National Science
Foundation-supported faculty development and science, technology,
engineering, and mathematics education reform initiative. SENCER
supports the development of courses and programs that connect course
content to real world problems, and by so doing, extend the impact
of learning across the curriculum to the broader community and
society. This approach has been especially effective in engaging
women, minority students, and students who major in non-STEM
fields." "The SENCER Summer Institute (SSI) 2009 is one
component of SENCER's national dissemination program designed to
improve undergraduate education and undergraduate science education,
especially in the STEM disciplines, and to stimulate civic
engagement through the design and development of courses and
programs that teach "to" basic science "through" complex, capacious,
and unsolved public issues."
Milo Schield, VP of the National
Numeracy Network, attended. -
Monday
Other:
-
Mari
Palta (U. Wisc.): Challenges in Teaching Advanced Statistical
Methods for Observational Studies in a Subject Matter Context -
William
S. Rayens (U. Ky):
A Course Template for Statistical Inferential Reasoning -
Roundtable: S. Dienstfrey: Removing the Veil from Publicly
Released Polls: What Is the Statistician's Role in the Fight to
Improve Statistical Literacy?
Tuesday 2
PM:
-
Leonhardt, Vedantam & Alpert (NY Times, Washington Post,
Barron's): Mediating Statistics in the Media Org:
Xiao-Li Meng, Harvard
-
Bill
Rybolt (Babbson College):
Why We Should Teach Introductory Applied Statistics Courses
Backwards
-
June 25-27, 2009.
USCOTS: US Conference on
Teaching Statistics: "Letting Go to Grow" Columbus, OH
Featured speakers
include Dani Ben-Zvi (University of Haifa), George Cobb (Mount
Holyoke College), Peter Ewell (Center for Higher Education Management
Systems), Ronald Wasserstein (Executive Director, ASA) and Chris Wild
(The University of Auckland). Workshop:
Teaching Statistical Modeling by Danny Kaplan and Victor Addono.
-
-
-
March 28
Northeast
Consortium for Quantitative Literacy (NECQL-XIII) at Smith College.
Neil Lutsky of
Carleton College will give a talk: Spreading Activation for
Quantitative Reasoning in a College Community: Themes for
Variations.
Rick Gillman of Valparaiso University will give
excerpts of his mini-course Game Theory as a Path for Quantitative
Literacy.
Announcements by Corri Taylor for the National
Numeracy Network (NNN) and Maura Mast for the MAA's Sigma QL.
-
-
-
Jan 5-8, 2009
MAA JMM: Washington, DC.
Current
schedule
Mon. 1/5 2:15-4:15. MAA Minicourse #7A. A Game
Theory Path to Quantitative Literacy. David Housman and Richard
Gillman
Mon. 1/5 4:30
Statistical
Significance of Ranking Paradoxes by Raymond N
Greenwell, Hofstra Univ.
General Contributed Papers III
6up
Tues 1/6, 2 PM, Poster:
Q/R in the Contemporary World. Bernie Madison, Caren
Diefenderfer, Stuart Boersma & Shannon Dingman
The project
includes making the course transportable, adaptable, and more
effective and creating assessments and scoring rubrics to both
measure learning in the course and to compare that learning to the
learning in two other courses, one somewhat similar and one
traditional. The innovative course derives from a collection of
newspaper and magazine articles and is organized by processes of QR
and not by mathematical or statistical topics. The project has
produced the first draft of case studies of QR-based media articles
and an accompanying volume documenting the learning results,
pedagogical strategies, and a guide for using the case studies in a
QR course is in progress.
Tues 1/6, 2 PM, Poster:
Mathematics Across the C/C Curriculum: A National Q/L Initiative.
Jim Roznowski & Christie Gilliland
Tues 1/6, 5:45 -7:15
PM. SIGMAA on Quantitative Literacy: Business Meeting
Wed January 7, 2009,
8:00 a.m.-10:35 a.m. MAA Session on
Quantitative Literacy Across the Curriculum
Organizers: Kimberly M. Vincent,
Washington State University, and Cinnamon Hillyard, University of
Washington, Bothell.
8:00 am. Making Quantitative Reasoning
Central to a PreCalculus Course. Cinnamon Hillyard* and Nicole
Hoover Slides 6up
8:20 am. QL from a Service Division Perspective. Gary T
Franchy, Davenport University
Slides 6up
8:40 am. Mathematics and Democracy. Kira
Hamman, Pennsylvania State University, Mont Alto
Slides 6up
9:00 am.
Using Media Article to Drive a Q/L Course. Stuart Boersma, Caren
Diefenderfer, Shannon Dingman and Bernard L Madison
6up
9:20 am.
Medical Accuracy: Content for a Quantitative Literacy Course.
Stuart Boersma & Teri Willard, Central Washington U.
Slides 6up
9:40
am. Building mathematical & computational skills of science
students. Kelly Matthews, Merrilyn Goos, Peter Adams,
U.Queensland 6up
10:00 am. Toward a Numerate Culture: A Quantitative Literacy
Project. D. Scott Dillery, Lindsey Wilson College
Slides 1up
10:20 am.
Incorporating Quantitative Literacy into the Research Writing
Classroom. Kimberly M Vincent, Washington State University
8:00 am. Facing Up to
the Realities of Quantitative Illiteracy. Betsy
Darken, University of Tennessee at Chattanooga
10:00 am. Achieving
Statistical Literacy in Elementary School Using Current Popular
Curricula. Anna Bargagliotti, Univ. Memphis
6up
2:15-4:15 pm.
MAA Minicourse #7B: A Game Theory path to Q/L. David Housman,
Goshen College, Richard Gillman, Valparaiso U.
3:50 pm.
Student difficulties negating mathematical statements and
translating to symbolic form. Bonnie Gold, Monmouth U.
4:40
pm. Numeracy: Assessing Basic
Skills and Knowledge. Milo Schield, W. M. Keck Statistical
Literacy Project. Slides 6up
12/2009: New
StatLit 2009:
All the news on statistical
literacy for 2009. Read about the new AACU rubric for assessing
quantitative literacy.
10/2009: New
StatLit-Blog:
Fighting Statistical Illiteracy;
promoting statistical literacy. Blogs include "Average: 2.8 M sexual
partners", "AP creates Bogus Crime Wave",
"AP misreads Percentage Table", "Employers
Rehiring… Really? and "SAT Scores Tell Us Zip!"
10/20:
Gerald Bracey:
Outspoken public schools advocate
Bracey dies at 69:
Obituary by Greg Toppo, USA Today. Dr. Gerald Bracey can rest
in peace – the rest of us need to get busy:
Generation YES Blog. Gerald W. Bracey, 69, one of the most
erudite, prolific and acidic critics of national education policy, died
unexpectedly early Oct. 20 at his home in Port Townsend, Wash.: Jay Mathews,
Washington Post,
4/10:
StatLit News 2009Q1.
The latest news on statistical literacy and
numeracy.
A Simple Guide to Voodoo Statistics
by Ian Schagen Chief Research Analyst New
Zealand Ministry of Education
2/20: Quantitative Literacy in Washington Post.
What is QL?
Test your Quantitative Literacy.
1/27:
Quantitative Scholarship: Quality Enhancement Program at University
of Texas San Antonio.
Proposal
"The Quantitative QEP includes two components: (1)
quantitative literacy
encompassing basic analytical skills such as data interpretation and (2)
quantitative mastery, which addresses ways to gather data, identify
sources of error and conduct other advanced analyses. These critical
thinking and problem solving skills are the same skills used by successful
researchers. They also are tested on the Graduate Record Exam (GRE)." "...
students must satisfy specific semester credit hours (SCH) requirements of
the University Core Curriculum. These requirements includes courses in
several domains: Natural Sciences: Level I (3 SCH), Natural Sciences: Level
II (3 SCH), Political Science (6 SCH), Social and Behavioral Science (3 SCH),
and Economics (3 SCH). The Quantitative QEP would embed
quantitatively-enriched materials in courses falling under all of these
Domains."
|
|
OUR TOP
25 BOOKS as of 2009 |
|
Choice and order based solely on the opinion of StatLit's webmaster
Rank, Author, Date and Title
-
*Lynn Steen (2001),
Mathematics and
Democracy:The Case for Q/L
-
*Joel Best (2002),
Damned Lies and Statistics
-
*Victor Cohn (1989), News and
Numbers
-
*Howard Wainer (2005),
Graphic Discovery: A Trout in the Milk and Other Adventures.
-
*Darrell Huff (1954), How To Lie
with Statistics
-
Jane M. Watson (2006),
Statistical Literacy at School
-
Gerald Bracey (2006),
Reading Educational Research: How to Avoid Getting Statistically Snookered
-
Robyn Dawes (2001),
Everyday
Irrationality
-
Gerd Gigerenzer (2002),
Calculated Risks: How to Know When Numbers Deceive You
-
*John Paulos (1988),
Innumeracy:
Mathematical Illiteracy and its Consequences
-
*Lynn Arthur Steen (2004),
Achieving
Quantitative Literacy
-
Stanley Lieberson (1985),
Making
It Count
-
Othmar Winkler (2009),
Interpreting Economic and Social Data: A Foundation of Descriptive
Statistics
-
Edward Tufte (1983),
The Visual
Display of Quantitative Information
-
*Jane Miller (2004), The Chicago
Guide to Writing About Numbers
-
*Joel Best (2004),
More Damned Lies and
Statistics
-
*Howard Wainer (2000),
Visual
Revelations
-
*Edward Tufte (1995),
Visual
Explanations
* Recommended for newcomers. |
-
*Lynn Steen (1997),
Why Numbers Count:
Quantitative Literacy for Tomorrow’s America
-
A. K. Dewdney (1995),
200% of
Nothing: From “Percentage Pumping” to “Irrational Ratios”
-
*John Brignell (2000),
Sorry, Wrong
Number
-
Hans Zeisel (1947), Say It With
Figures
-
*John Brignell (2004),
The
Epidemiologists
-
John Allen Paulos (1995),
A
Mathematician Reads the Newspaper
-
*Roxy Peck, Daren Starnes, Henry
Kranendonk and June Morita (2009),
Making Sense of Statistical Studies
* Recommended for newcomers.
PRAISE-WORTHY CONTENDERS:
-
Richard Gillman (2006),
Current Practices in Quantitative Literacy
-
John Allen Paulos (1993), once upon a number: the hidden
mathematical logic of stories
-
Jane Miller (2005),
The Chicago
Guide to Writing About Multivariate Analysis
-
*David Murray, Joel
Schwartz & Robert Lichter (2001). It Ain’t Necessarily So. How
Media Make & Unmake the Scientific Picture of Reality.
-
Phillip Meyer (1991),
The New Precision Journalism
-
Lynn Steen, Editor (1990), On The Shoulder’s Of Giants: New
Approaches to Numeracy
-
Sarah Cohen (2001), Numbers in the Newsroom: Using Math and
Statistics in the News
-
Stephen K. Campbell
(1974), Flaws and Fallacies in Statistical Thinking
|
|
AMAZON's TOP
TEXTBOOKS 2009 |
|
Ranks based on sales rankings at Amazon.com as of 8/2009.
These rankings fluctuate daily and don't
include sales made directly by publishers to bookstores.
Rankings via www.salesrankexpress.com
Rank Author and Title
1,244 Bennet & Briggs:
Using & Understanding Math: QR Approach
2,430
Gonick and Smith:
Cartoon Guide to Statistics*
3,848
Rumsey:
Statistics for Dummies*
4,528 COMAP:
For All Practical Purposes: Mathematical Literacy
...
5,026
Moore, McCabe, Craig:
Introduction to the Practice of Statistics*
5,795
Field:
Discovering Statistics Using SPSS*
6,148 Burger and Starbird:
Heart of Mathematics
7,072
Freedman, Pisani and Purves:
Statistics*
8,497 Utts:
Seeing Through Statistics
9,254
Larson and Farber:
Elementary Statistics: Picturing the World*
11,603 Triola:
Elementary Statistics*
12,542
Salkind:
Statistics for People Who (Think They) Hate Statistics*
13,092
Bluman:
Elementary Statistics: A Step By Step Approach*
16,866
Voelker, Orton and Adams:
Statistics (Cliffs Quick Review)*
17,022
Donnelly:
The Complete Idiot's Guide to Statistics*
17,528
Hand:
Statistics -- A Very Short Introduction*
18,361
Sullivan:
Statistics: Informed Decisions Using Data
21,049
Triola:
Essentials of Statistics*
21,525
Brase and Brase:
Understandable Statistics*
22,154
Kiess and Green:
Statistical Concepts for Behavioral Sciences*
27,165
Nolan and Heinzen:
Statistics for the Behavioral Sciences*
27,549 Moore and Notz:
Concepts and Controversies 28,346 Howell:
Fundamental Statistics for the Behavioral Sciences*
28,467
Woloshin, Schwartz, Welch:
Know Your Chances: Health Stats*
|
32,359
Utts and Heckard:
Mind on Statistics*
35,094
Sprinthall:
Basic Statistical Analysis*
35,674 Moore:
The Basic Practice of Statistics*
39,104
Witte and Witte:
Statistics*
45,788
Gravetter, Wallnau and Hague:
Essentials of Statistics*
57,428
Agresti & Finlay:
Statistical Methods for Social Sciences*
67,602
Johnson:
Statistics: Principles and Methods*
71,717
Agresti, Franklin:
Statistics:
Art/Science Learning from Data*
96,236
Sevilla and Somers:
QR Tools for Today's Citizen
116,609 Urdan:
Statistics in Plain English*
130.091
Miller, Heeren and Hornsby:
Mathematical Ideas*
149,568
McClave, Sincich and Mendenhall:
Statistics*
163,858
Andersen, Swanson:
Understanding our Quantitative World
229,342
Sullivan:
Fundamentals of Statistics*
267,500
Bennet, Briggs, Triola:
Statistical Reasoning For Everyday Life
272,723
Aufmann and Lockwood:
Mathematical Thinking and QR
387,527
Rossman, Chance, Lock:
Workshop Statistics*
397,508
Bennett, Briggs:
Essentials of Using and Understanding Math*
837,830
Rossman, Chance:
Investigating Statistical Concepts ...*
855,570 Richman et al:
Mathematics for Liberal Arts
883,473 Sons:
Mathematical Thinking & Quantitative
Reasoning
1,227,440 Abramson and Isom:
Literacy
and Mathematics
1,308,574
Fusaro, Kenschaft:
Environmental Math in the Classroom*
1,342,288 Bennett, Briggs:
Themes of the Times on QL*
1,595,528 Pierce, Wright, Roland:
Mathematics for Life: ... QL*
2,180,080 Langkamp and Hull:
QR and the Environment
3,435,423 Greenleaf:
Quantitative Reasoning: Understanding Nature
3,750,127 Burkhart: Quantitative and Qualitative Reasoning Skills
* Ranks as of March, 2010 |
|
TOP
STATLIT SITE-PAPERS VIEWED IN 2009 |
|
Papers with over 100 views at
www.StatLit.org in 2009.
Total downloads: (184,000 in 2009; 106,000
in 2008).
Numbers in parenthesis are (2009, 2008) counts.
-
Percentage
Graphs in USA Today. Milo Schield 2006 ASA (13,253 viewings in
2009; 14,247 in 2008) [Includes screen, print and 6up
versions]
-
Exploring Simpson's Paradox. Larry Lesser (Univ. Texas, El Paso) NCTM
2001 (2,844; 913)
-
Presenting Confounding Graphically Using Standardization
(1,985; 1,616).
Milo Schield, 2006 Draft for Stats magazine
-
Quantity Words Without Numbers: Why Students use "Many".
Milo Schield 2005 Carleton (1,863; 2,090)
-
Q/R Textbooks PDF of
StatLit Q/R textbook web-page (1,532)
-
Interpreting the substantive significance of multivariate
regression coefficients
by Jane Miller 2008 ASA
(1,412)
-
The Cult of Statistical
Significance by Stephen Ziliak and Deirdre McCloskey
*2009* ASA 6up
4up (999)
-
Frequency of Simpson's
Paradox in NAEP Data. Jim Terwilliger & Milo Schield, 2004 AERA
(1,070; 678)
-
Univ. Texas San Antonio: Quantitative Scholarship - Final Draft
Press Release *2009* (1,174) [#
includes paper and
press release]
-
Some Difficulties Learning
Histograms. Carl Lee & Maria Meletiou-Mavrotheris ASA 2003
(991; 1,179)
-
Just Plain Data Analysis: Common
Statistical Fallacies.... Gary Klass (Illinois State University)
2008 ASA (991; 499)
-
Statistical Literacy:
An Online Course
at Capella University. Marc Isaacson (Augsburg College)
2005 ASA (902; 1,202)
-
Quantitative Reasoning: An
Activity-Based Course,
Sommers 2007 ASA 6up slides (899; 294)
-
People Count: The Social
Construction of Statistics. Joel Best 2002 Presented at ASA (803; 1,087)
-
Ambiguity
Intolerance: An Impediment to Inferential Reasoning?
Robert Carver 2006 ASA (797)
-
Statistics for Political Science
Majors. Gary Klass 2004 ASA (765; 215)
-
Online Program Decoding
English Descriptions
and Comparisons of
Percentages & Rates. Burnham & Schield 2005 ASA (782; 1,070)
-
What do M&M's, Dahlias, Soil Erosion
and Data Analysis ... Have in Common? Jerry
Moreno, 2006 ASA (817; 158)
-
Accuracy and Apparent Accuracy in Medical
Testing by Stuart Boersma and Teri Willlard
6up slides
*2009* NNN (781)
-
Numeracy: Assessing Basic Skills and
Knowledge
by Milo Schield *2009* MAA JMM 6up
(514)
-
Programme:
European Conference on Methodology 2008 Spain (708)
-
Statistical Literacy &
Mathematical Thinking. Milo Schield 2000 ICME (681; 997)
-
Focus on Basic 2008
9A:
World Education (539).
Using Part-Whole Thinking in Math by Dorothea
Steinke; Numeracy Matters by Myrna Manly; Designing
Instruction with the Components of Numeracy in Mind by Lynda Ginsburg; Changing Practice, Expanding Minds by Kate Nonesuch;
Is Math Universal?
Interview of Joanne Kantner by FOB; Numeracy at the Downtown Learning Center
by Avril DeJesus; The Importance of Algebra for Everyone by Tricia
Donovan; TIAN: A Professional Learning Model for ABE Math Teachers by
Beth Bingman & Mary Jane Schmitt; Arizona's Professional Learning Journey
through the Teachers Investigating Adult Numeracy Project by Beverly Wilson
& D. Roberto Morales; News from World Education.
-
Pedagogical Challenges of Quantitative Literacy. Bernie Madison,
President of NNN, 2006 ASA (476; 468)
-
The
Components of Numeracy. Ginsburg, Manly & Schmitt 2006 NCSALL (466; 235)
|
-
Spinning Heads and Spinning News: Statistics in the
Media by Rebecca Goldin George Mason U.
*2009* ASA
6up (459)
-
Social Mathematics in US Civics
Curriculum. James Mauch
dissertation 2005 (442; 470)
-
-
Statistical Significance of
Ranking Paradoxes
by Anna Bargigliotti and Jim Greenwell *2009* MAA JMM (410; 147)
-
Statistical Literacy Skills Survey
by Milo Schield, 2008 PKAL-Carleton.
6up slides.(392)
-
Why Should We Even Teach Statistics? A Bayesian
Perspective.
Gudmund Iversen, 2000 Tokyo Round Table (370; 790)
-
Distinguishing Association from
Causation in Media Headlines by Milo Schield and Robert Raymond
*2009* ASA. 6up
(362)
-
Confound Those Speculative
Statistics Milo Schield *2009* ASA 6up
(361)
-
Teaching the Social Construction of Statistics
by Milo
Schield, 2007 Midwest Sociological Society (340; 754)
-
Statistical Challenges in Medical Research: What Consumers Need to
Know, Ronald R. Gauch (Marist College) *2009* ASA
6up (334)
-
Statistical Literacy
Curriculum Design by Milo Schield 2004
IASE Curriculum Roundtable, Lund Sweden (331)
-
Mathematics and Democracy: A Course in Quantitative and Political
Literacy by Kira Hamman, *2009* JMM
6up
slides (323)
-
Three Paradoxes.
Howard Wainer and Lisa Brown, Nat. Board of Med. Examiners. Draft for American Statistician 2004 (315; 750)
-
Bracey
Principles by Gerald Bracey 2006 (312)
-
People Count: The Social
Construction of Statistics 2002 Talk at Augsburg College (310)
-
Sencer 2009 Statistics
Symposium Program. Metropolitan State U.[282]
-
Statistical
Prevarication: Telling Half Truths Using Statistics. Schield,
2005 IASE (256; 898)
-
10 Questions to Ask for Q/R, Neil Lutsky
(Carleton), 2006
ASA (210; 437)
-
Teaching Causal Inference
in Experiments and Observational Studies by Donald Rubin, 1999 ASA (209)
-
Statistical Literacy: An
Evangelical Calling for Statistical Educators. Milo Schield,
2005 ISI (192; 304)
-
Trashball: A
logistic Regression Activity, Morrell & Auer 2004 ASA (191)
-
Poster: Using
Media Articles to Drive a Quantitative Literacy Course by Madison, Boersma,
Deifenderfer and Dingman.
*2009* MAA
6up slides (681)
-
Analyzing Numbers in the News: A Structured Approach.
Milo Schield 2008 NNN (171; 169)
-
The Final Report of the
National Mathematics Advisory Panel, 2008 US Dept of Education (166)
-
Mathematics Across the
Curriculum: Inspiration & Resources (and Opportunities), Rebecca
Hartzler 2008 “MAC & QR - Multiple
Collegiate Models” Borough of Manhattan Community College
6up
(157; 142)
-
Connections between Experimental and
non-experimental designs by Elizabeth Stuart *2009* ASA
1up (150)
-
Achieving Statistical Literacy in Elementary
School Using Current Popular Curricula by Anna E. Bargagliotti MAA *2009*
6up (140)
-
Making QR Central to Pre-Calculus Course by
Cinnamon Hillyard and Nicole Hoover MAA *2009*
6up (136)
-
News Math Course Description and
Procedures Bernie Madison, 2005 Univ. Arkansas (104; 214)
12/2009: The StatLit website hosted 533 pdfs of papers and 153 pdfs of slide handouts.
|
|
TOP
STAT-LIT SITE-PAGES VIEWED IN 2009 |
Top StatLit Pages Viewed at
www.StatLit.org in 2009
(###; ###): page views in 2009; 2008.
-
Welcome (15,729; 10,423): Home/Index
page. Site overview.
-
Joel Best
(3,481; 3,118): Author of "More Damned Lies & Statistics"
-
StatLit Papers
(2,837; 2,444): Papers, articles or presentations.
-
Gerald
Bracey (2,669; 2,035): Author of "Reading Educational Research"
-
StatLit News 2008 (2,634):
Stat-Lit News from 2008.
-
Q/L Textbooks
(2,484; 2,387): Details on Q/R or Q/L textbooks.
-
Adult Numeracy (2,467; 1,987): News on
adult numeracy projects.
-
Standardizing (2,434; 1,718): Excel graph
illustrates standardizing.
-
Howard Wainer (2,127; 1,966):
Author of "A Tout in the Milk".
-
John Paulos (1,845; 1,669):
Author of "Numeracy".
-
StatLit News 2007 (1,498; 1,928):
Stat-Lit News from 2007.
-
Q/L Books
(1,418; 1,459): Q/L-related books (not texts).
-
Gerd
Gigerenzer (1,415; 1,503):
Author of "Calculated Risks"
-
StatLit News 2006 (1,386; 1,523):
Stat-Lit News from 2006.
-
2002 W.
M. Keck Statistical Literacy Survey Web version (1,452)
-
StatLit Books
(1,346; 1,680): Over 300 Stat-Lit related books.
-
Q/L Activities
(1,278; 1,378): Details on Q/L-related activities.
-
Dennis Haack (1,199; 1,276): Author of "Statistical Literacy" 1979
-
StatLit
News 2004
(1,191; 1,183: Stat-Lit News from 2004.
|
Note: Website statistics are tabulated by
the DeepMatrix program LiveStats® .XSP V8.03. Each month, the views
for the top 25 website pages are tabulated. Those pages that
aren't in the top 25 that month are treated as having zero views.
Thus the annual totals for the most popular pages (e.g., Home page)
are quite accurate, whereas those with the lowest ranks are
understated.
Pages with less than 12 months statistics*
have been adjusted: multiplied by 12 over the number of months
tabulated. Pages with less than 8 months of statistics are
omitted (except for those that are student assigned during just
certain months during the year).
In 2009, the StatLit web site consisted of
36 pages in the main directory (including the 5 navigation pages)
plus the student-assigned pages (/GC) and the Keck Statistical
Literacy survey.
Navigation page views totaled 9,522 (8,474): Statistical
Literacy 2,396 (2,100), StatLit News
1,928* (1,863), Authors 2,033* (1,860), Statistical
Reasoning 1,625 (1,425) and
Numeracy 1,540 (1,226).
Student-assigned (involuntary) pages views
[all through /GC] totaled 3,907 (5,548). These included the
grammar-checker programs (SLRSV.aspx; four versions) with 1,988
(3,374) views and the
Part-Whole program (PartWholeImages.aspx)
with 1,919 (2,169) views.
|
|
TOP
10 SITE SEARCH-TERMS |
Top 13 terms in search referrals to
www.StatLit.org.
Search referrals (2009; 08; 07).
References
shown are likely targets.
-
Joel Best (835; 1,147; 594):
See Joel Best author page. [Could be Billie
Joel]
-
graphs (567; 654; 634): Schield
Percentage Graphs in USA Today
-
Howard Wainer (424;340; 110): See
Howard Wainer
author page.
-
Statistical Literacy
(341; 385; 249): See Statistical Literacy.
-
Quantity words
(317; 547; 264): See Schield, Why
Students Use 'Many'?
-
Standardiz... (240; 100; 131):
Schield, Adjusting for
Confounding Graphically.
-
Numeracy and Math across curriculum
(197; 75; 60): See Numeracy
-
Significance, substantial and statistical (168)
|
-
Gerald Bracey (162; 214; 94): See
Gerald Bracey author page.
-
Data (80)
-
Simpson Paradox
(45; 59; 54): Schield, "Adjust for
Confounding Graphically".
-
Social construction and ambiguity (38): See
Schield, Teaching the Social
Construction of Statistics
-
quantitative reasoning (22; 33):
See Numeracy or Q/L
Each month, LiveStats ranks the search
terms used and captures the top 20 with the associated number of
referrals. In 2009, this generated 92 unique search terms with
3,707
visits (plus 17,403 Other) for a total of 21,110 total search
referrals. These 92 search terms were grouped by search phrase
(so 'standardizing' and 'standardized' were counted together) into
30 groups. Note that these numbers are very sensitive to
how search terms are grouped into search phrases. Note that
most of the search
referrals are tabulated under Other.
|
|
GOOGLE SITE RANKINGS |
|
Google rated www.StatLit.org as the #1 site for Statistical Literacy for the 5th year.
Google ranking (12/09) of
www.StatLit.org.
When multiple words are shown, they
are searched as a phrase.
#1: Statistical literacy (1,1), Joel
Best, Howard Wainer, Bernie Madison,
statistical prevarication, chance grammar, spurious association, statistical doublespeak,
percentage graphs, data literacy
#2: Dennis Haack, percentage
grammar, statistical paradoxes
#3: USA Today graphs, interpreting
doublespeak,
standardizing, multivariate thinking, journalistic significance, adult
numeracy
Top 10:
John Paulos (), Milo Schield (), Gerald Bracey (), statistical illiteracy (), quantity words ()
|
Top 30: statistically literate (14), innumeracy (15), numeracy (40),
confounder ()
Top 100: Gigerenzer (),
statistically illiterate (), social construction (), Lynn Steen
(), confounding (), Simpson's paradox (74), statistics (), statistical
reasoning (61), quantitative literacy (64)
This site was not in the first 100 for chance, confound,
confounded, critical thinking, financial literacy, health literacy, health numeracy,
induction, quantitative reasoning, spurious, standardization or statistical education.
Process: Search on phrase (in quotes); Find "StatLit.org" on page.
|
|
2009 IASE: Durban |
|
 2009 09/23/22