Website Highlights: 11th Year
Anniversary
-
StatLit.org still growing:
Index views up 61%; Page views up 19%; Downloads up 8%; Visits
up 5%.
More than 265,000 downloads, 190,000 visits, 150,000 page views
and 47,000 home page views.
-
4 new pages:
Uri Bram, Conrad Carlburg,
Kaiser Fung and David
Moore
-
Google ranked StatLit.org #2 for
"statistical literacy" (Wikipedia as #1)
-
New records: StatLit.org has had more
than a MILLION downloads, 950,000 visits and 710,000 page views inception-to-date (2004-2013).
|
|
|
|
Editor: Top New Conference Papers in 2013
|
|
TOP DOWNLOADS during 2013 FROM
STATLIT.ORG |
|
|
|
|
NUMERACY
(NNN) JOURNAL in 2013 |
 Numeracy:
E-Journal Numeracy:
E-Journal
Numeracy is an open-access, peer-reviewed
journal launched in 2008. Numeracy aims to support
education at all levels that integrates quantitative skills across
disciplines. The journal seeks evidence-based articles. See Vacher's
NECQL and
PKAL presentations. |
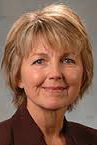
  Numeracy
Editors Numeracy
Editors
Len Vacher (left) and Dorothy Wallace (right)
are editors of Numeracy: Advancing Education in Quantitative
Literacy published by the National
Numeracy Network, supported by U. of S. Florida Libraries and hosted
by
the Berkeley Electronic Press™. |
2013: Volume
6,
Issue 1
|
2013 Volume 6,
Issue 2: Financial Literacy
- Editorial:
Financial Literacy and Quantitative Reasoning in the High School and
College Classroom by Annamaria Lusardi & Dorothy Wallace.
-
The
Geography of Financial Literacy: Bumcrot, Lin, and Lusardi.
-
Financial Literacy and Credit Card Behaviors by S. Allgood & W.
Walstad
-
In
Our Best Interest: Women, Financial Literacy, and Credit Card
Behavior by Gary R. Mottola
-
Financial Literacy and Financial Behavior among Young Adults:
Evidence and Implications by Carlo de Bassa Scheresberg
-
Financial Literacy and Retirement Planning in Switzerland, Brown
& Graf
-
Financial Literacy and Retirement Planning in Australia by Julie
R. Agnew, Hazel Bateman, and Susan Thorp
-
Financial Literacy and Financial Planning in France by Luc
Arrondel, Majdi Debbich, and Frédérique Savigna
-
Financial Literacy and Household Savings in Romania by E.
Beckmann
-
Making College Count: An Examination of Quantitative Reasoning
Activities in Higher Education by Rocconi, Lambert, McCormick &
Sarraf
-
Does Completion of Quantitative Courses Predict Better Quantitative
Reasoning-in-Writing Proficiency? Nathan D. Grawe
-
Simplified Data Envelopment Analysis: What Country Won the Olympics,
and How about our CO2 Emissions? by
Alexander Vaninsky
- Column:
Parts of the Whole: The Educational Sieve by
Dorothy Wallace
|
GRANTS FOR QR, QL, SR, ST and SL in 2013 |
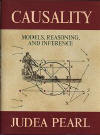
 Pearl:
Causality in StatEd Prize Pearl:
Causality in StatEd Prize
Judea Pearl, winner of the
ACM 2011 Turing award, funded the
ASA Causality in Statistics
Education Prize for three years. Criteria: "does the
most to enhance the teaching and learning of causal inference in
statistics." The extent to which the material submitted (1)
equips students with skills needed for effective causal reasoning, and (2)
assists statistics instructors in gaining an understanding of the basics
of causal inference ..." |
 Elwert
Wins ASA Causality Prize Elwert
Wins ASA Causality Prize
The ASA awarded the
first Causality
prize to Felix Elwert (Sociology, UW-Madison) for his
innovative two-day
course, Causal Inference with Directed Acyclic Graphs. This
graduate
course "reviews causal
and counterfactual concepts; principles of directed acyclic graphs;
nonparametric identification by conditioning; conceptual differences
between confounding, over-control, and selection bias; examples and
exercises." |
 Engaging
Mathematics Engaging
Mathematics
NSF awards $599,995 to
Wesleyan University for
Passion-Driven Statistics: A multidisciplinary project-based supportive
model for statistical reasoning and application.
Disseminating a project-based course that provides greater access to
introductory statistics for non-STEM students. PI:
Lisa Dierker (left); Co-PI: David Beveridge. Four-year award
1323084 |
 Causal
Inference w. Confounding Causal
Inference w. Confounding
NSF awards UCLA $299,919 for Causal and Statistical
Inference in the Presence of Confounding Factors. Will develop
a theory of how confounders affect data and under what conditions
unobserved confounders can be corrected. Proposed theory is
related to recent developments in understanding sparsity as
studied in EE, CS & statistics. PI:
Eleazar Eskin; 3 year
1320589 |
 Causal
Inference; Obs. Studies Causal
Inference; Obs. Studies
NSF awards $296,587 to the
University of Pennsylvania- Wharton for Causal Inference in
Observational Studies. The design of an observational study strongly
affects its sensitivity to hidden biases. This project investigates four
ways that study design can mitigate confounder bias.
PI: Dylan
Small (right); Co-PI: Paul Rosenbaum
3 year grant
1260782 |
 Challenge Students w Big Data Challenge Students w Big Data
NSF awards $600,000 to
Jackson
State University for Laboratory for Interdisciplinary Statistical
Analysis and Mathematical Learning Through Quantitative Exploration of
data Design ways to use big data to educate math-stats
undergraduates to confront challenges. PI:
Tor Kwembe; Co-PIs: Xing
Yang, Zhenbu Zhang, Raphael Isokpehi and Remata Reddy; Award
Number:1330801
|
 MidSchool:
Stat. Misconceptions MidSchool:
Stat. Misconceptions
NSF awards $406,762 to
Measured Progress for
The MAMMS Project: Measuring and Addressing Middle-Grades Misconceptions
in Statistics. Develop diagnostic assessments to identify
specific statistical misconceptions (datasets as entities, comparing
datasets, and overreliance on the mean procedure), teacher tutorials and
activities. PI:
Jessica
Masters. 3-year
1312133 |
 Child
Learn: Probability Displays Child
Learn: Probability Displays
NSF awards $499,210 to
Univ. of Washington for
Young Children's Causal Learning from Probabilistic Social and Physical
Displays. To investigate whether young children observing a
confounded causal system preferentially attribute probabilistic outcomes
to variability in social causes or to variability in physical causes.
PI:
Andrew Meltzoff. Three-year award
1251702 |
 Conditional
Inference in Tables Conditional
Inference in Tables
NSF awards $57,049 to Brown University for Conditional
Inference Algorithms for Graphs, Tables, and Point Processes.
Conditioning on the margins simplifies the statistical challenges, it
greatly increases the computational challenges of any associated
statistical procedures. This project addresses this problem.
PI: Matthew Harrison.
Three-year
1309004 |
 Engage
Students in QR via Data Engage
Students in QR via Data
NSF awards $199,656 DUE award to Illinois State
University for "The use of high-frequency data to engage students in
quantitative reasoning and scientific discourse" ; PI:
Catherine O'Reilly; Co-PIs: Rebekka Darner, Cayelan Carey.
One-year grant
1245707 |
 Numeracy & Risk Literacy Numeracy & Risk Literacy
NSF awards $49,866 to
Michigan Technological University for
CAREER: Numeracy and Risk Literacy. This project maps
cognitive processes and individual differences linking them with
numeracy and risk literacy across diverse populations. PI:
Edward Cokely (founder of
RiskLiteracy.org). Five-year
1253263
|
Estimate Causal Impact of Wealth
NSF awards $95,740 to
the National Bureau of Economic Research for Collaborative Research:
Novel Approaches Toward Estimating the Causal Impact of Wealth.
PI: Matthew Notowidigdo. One-year Award
Number:1326722;
NSF awards $96,863 to New York University for the same collaborative
Research. PI:
David
Cesarini. Award Number:
1326635 |
|
|
 The
Peter Holmes Prize The
Peter Holmes PrizeTeaching
Statistics announces the Peter Holmes Prize. "In honour of the
journal’s founding Editor, the Peter Holmes Prize will be awarded to the
best classroom idea published in Teaching Statistics in a given year."
See Peter's 1986 ICOTS paper, a
video of his 2003 talk at Augsburg, and a video of his 2008 ICOTS talk. |
|
NEW BOOKS in 2013: POPULAR |
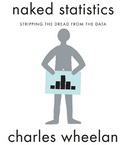 Naked
Statistics Naked
Statistics
"Naked Statistics: Stripping the Dread from the Data" by
Charles Wheelon, author of "Naked Economics." $18. "focuses on the
underlying intuition that drives statistical analysis. He clarifies key
concepts such as inference, correlation, and regression analysis.."
"shows us how ... researchers are exploiting .. data from natural
experiments to tackle thorny questions." |
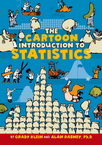 Cartoon
Intro to Statistics Cartoon
Intro to Statistics
$15 by Grady Kline and Alan Dabney. "most imaginative and accessible
introductory statistics course you’ll ever take." "an irresistible cast"
of dragon-riding Vikings, lizard-throwing giants, and feuding aliens."
"teach you how to collect reliable data, make confident statements based
on limited information, and judge the usefulness of polls..." |
 Questions
on Quant Interviews Questions
on Quant Interviews
150 Most Frequently Asked Questions on Quant Interviews (Pocket Book
Guides for Quant Interviews) by Dan Stefanica, Rados Radoicic and Tai-Ho
Wang. "These questions are frequently and currently asked on
interviews for quantitative positions, and cover a vast spectrum, from
C++ and data structures, to finance, brainteasers, [probability,]
and stochastic calculus." $27 224 pg. |
 Forecasting
versus Predicting Forecasting
versus Predicting
Upgrading Leadership's Crystal Ball: Five Reasons Why Forecasting Must
Replace Predicting and How to Make the Strategic Change in Business and
Public Policy by Jeffrey Bauer. Readers will learn the
real-world value of distinguishing between predicting (extrapolating
historical trends) and forecasting (estimating the probabilities of
possibilities). $28 168 pages. |
|
 NumberSense:
Using Big Data NumberSense:
Using Big Data
NumberSense: How to Use Big Data to Your Advantage
by Kaiser Fung (author of Numbers Rule Your
World). "The problem is, the more data we have, the more
difficult it is to interpret it." "Everyone is prone to making critical
decisions based on poor data interpretations." "explains when you
should accept the conclusions of the Big Data 'experts' and when you
should say, 'Wait'." $18 |
 Stats
& Curiosities: Harvard Stats
& Curiosities: Harvard
Stats and Curiosities: From Harvard Business Review by Harvard
Business Review. $12 Packed with interesting associations such as
"Larger teams slow processes, develop larger forecasting errors, hamper
co-ordination, increase conflicts, and diminish motivation. The ideal
team size is two." "Reading too much useless information makes
people 46% less likely to think clearly." |
NEW BOOKS in 2013: PROFESSIONAL |
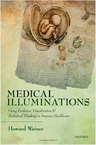 Statistical
Thinking & Healthcare Statistical
Thinking & Healthcare
Medical Illuminations: Using Evidence, Visualization and Statistical
Thinking to Improve Healthcare by Howard Wainer. "Medical
Illuminations presents 13 contemporary medical topics (cf. mammograms,
hip replacements, cancer maps). In each case it illustrates how modern
tools of statistical thinking and statistical graphics can illuminate
our understanding." $28 192 p [Jan 4, 2014] |
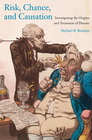 Risk,
Chance, Causation Risk,
Chance, Causation
Risk, Chance and Causation: The Origin and Treatment of Disease by
Michael B. Backen (Yale). Describes how professional scientists
approach questions of disease causation and therapeutic efficacy to
provide readers with the tools to help them understand whether warnings
of environmental risk are truly warranted, or if claims of therapeutic
benefit are justified. $48 344 pages |
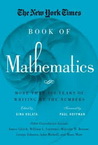 NY
Times Book of Mathematics NY
Times Book of Mathematics
The New York Times Book of Mathematics: More Than 100 Years of Writing
by the Numbers by Gina Kolata (Editor) and Paul Hoffman (Foreword).
"110 articles written from 1892 to 2010 that cover statistics,
coincidences, chaos theory, famous problems, cryptography, computers,
and many other topics." "a must-have for any math and science
enthusiast!" $13 |
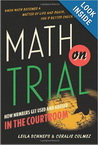 Math
on Trial: # in Courtroom Math
on Trial: # in Courtroom
Math on Trial: How Numbers Get Used and Abused in the Courtroom by
Leila Schneps and Coralie Colmez. $19. "ten trials spanning from the
nineteenth century to today, in which mathematical arguments were
used—and disastrously misused—as evidence." Shows "how the improper
application of mathematical concepts can mean the difference between
walking free and life in prison." |
 Probably
Approximately Correct Probably
Approximately Correct
Probably Approximately Correct: Nature's Algorithms for Learning and
Prospering in a Complex World by Leslie Valiant.
Publisher: "a unifying theory that will revolutionize our understanding
of how life evolves and learns." Shows "how both individually and
collectively we not only survive, but prosper in a world as complex as
our own." "Profound implications." $21 HC |
 Probabilistic
Thinking Probabilistic
Thinking
Probabilistic Thinking: Presenting Plural Perspectives (Advances in
Mathematics Education) edited by Egan Chernoff and Bharath Sriraman.
"four main perspectives: Mathematics and Philosophy, Psychology,
Stochastics and Mathematics Education." Coordinates "three
theoretical perspectives: classical, frequentist, and subjective."
"6 prefaces, 29 chapters and 6 commentaries." $171 700 pg. |
 Raw
data is an Oxymoron Raw
data is an Oxymoron
"Raw Data" Is an Oxymoron edited by Lisa Gitelman. "eight
episodes in history of data from the predigital to the digital. Together
they address such issues as the ways that different kinds of data and
different domains of inquiry are mutually defining; how data are
variously "cooked" in ... their collection and use; and conflicts
over what .. can't be ..reduced" to data." $27 192 pg |
 Using
Propensity Scores Using
Propensity Scores
Using Propensity Scores in Quasi-Experimental Designs by William
Holmes. "examines how propensity scores can be used to reduce bias
with different kinds of quasi-experimental designs and to fix or improve
broken experiments. Minimal use of matrix and vector algebra, the book
covers the causal assumptions of propensity score estimates and their
many uses.." $48 432 pg pb |
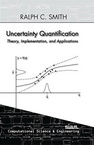 Uncertainty
Quantification Uncertainty
Quantification
Uncertainty Quantification: Theory, Implementation, and Applications
by Ralph Smith. Increasing emphasis on models requires "quantified
uncertainties for large-scale applications, novel algorithm development,
and new computational architectures that facilitate implementation of
these algorithms." This book "provides readers with the basic concepts,
theory, and algorithms .." 401 pages $67. |
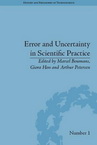 Error
and Uncertainty Error
and Uncertainty
Error and Uncertainty in Scientific Practice (History and Philosophy of
Technoscience) by Marcel Boumans, Giora Hon and Arthur Petersen (Dec
31, 2013) Contributors to this volume ...
compare methodologies and present the ingredients needed for an
overarching framework applicable to all. $67 256 pg |
|
|
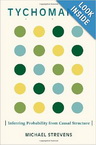 Inferring
Probabilities Inferring
Probabilities
Tychomancy: Inferring Probability from Causal Structure by Michael
Strevens. "Tychomancy—'the divination of chances'—presents a set
of rules for inferring the physical probabilities of outcomes from the
causal or dynamic properties of the systems that produce them."
The rules (1) are reliable, (2) are known to everyone, (3) have played a
crucial .. role" in science. $34 280 pages |
|
NEW BOOKS in 2013: TECHNICAL |
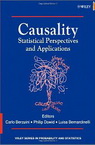 Causality
and Statistics Causality
and Statistics
Causality: Statistical Perspectives and Applications (Wiley Series in
Probability and Statistics) edited by Berzuin, Dawid and
Bernardinell. Collection of seminal contributions by experts including
Cox, Sjolander, Dawid, Greenland, Shipster, Arjus, Berzuni, Vanderweele,
Vansteelandt, Pearl, Ramsahai, Daniel, Rutter, Rosenbaum, Emsely,
Eichler and Bowsher. $77 416 pg |
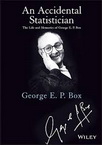 George
Box: Autobiography George
Box: Autobiography
An Accidental Statistician: The Life and Memories of George E. P. Box
by George E. P. Box. "Dr. Box taught himself the
statistical methods necessary to analyze his own findings when there
were no statisticians available to check his work." Includes "his
research with time series analysis, experimental design, and the quality
movement.." $34 304 pages. |
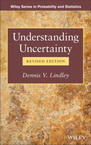 Understanding
Uncertainty Understanding
Uncertainty
Understanding Uncertainty (Wiley Series in
Probability and Statistics) by Dennis V. Lindley. $106. 424 pages;
$165. A consideration of betting, showing that a bookmaker's odds
are not expressions of probability; demonstration that
significance tests, may be unsound, even seriously misleading, because
they violate the rules of probability..." REVISED Edition $106
424 pages. |
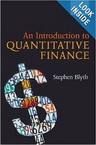 Quant.
Finance: Derivatives Quant.
Finance: Derivatives
An Introduction to Quantitative Finance by Stephen Blyth.
"provide a suitably rigorous yet accessible foundation to tackle
problems the author encountered whilst trading derivatives on Wall
Street. The book combines an unusual blend of real-world derivatives
trading experience and rigorous academic background." $32 192 pages pb. |
|
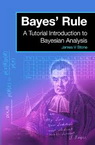 Bayes
Rule: A Tutorial Intro. Bayes
Rule: A Tutorial Intro.
Bayes' Rule: A Tutorial Introduction to Bayesian Analysis by James V
Stone. "Bayes' rule is a cornerstone of modern
probability theory." Shows "how Bayes' rule is actually a natural
consequence of commonsense reasoning. Bayes' rule is derived using
intuitive graphical representations of probability, and Bayesian
analysis is applied to parameter estimation using the MatLab programs
provided." $23 |
 Think
Bayes Think
Bayes
Think Bayes by Allen B. Downey. If you know Python and probability,
"you’re ready to tackle Bayesian statistics." "learn how to solve
statistical problems with Python instead of mathematical notation; use
discrete probability distributions instead of continuous math." "Once
you get the math out of the way, the Bayesian fundamentals become
clearer." $25 210p pb. |
|
NEW BOOKS in 2013: BIG DATA--GENERAL |
|
 Big
Data: A Revolution Big
Data: A Revolution
Big Data: A Revolution That Will Transform How We Live, Work, and Think
by Viktor Mayer-Schönberger and Kenneth Cukier. "A
revolution on par with the Internet or perhaps even the printing press,
big data will change the way we think about business, health, politics,
education, and innovation in the years to come. It also poses fresh
threats..." $21 hc 256 pages. |
 Understanding
/ Using Analytics Understanding
/ Using Analytics
Keeping Up with the Quants: Your Guide to Understanding and Using
Analytics by Thomas H. Davenport and Jinho Kim. "This book
promises to become your 'quantitative literacy' guide—helping you
develop the analytical skills you need right now in order to summarize
data, find the meaning in it, and extract its value." "How to
interpret and communicate analytical results." $20 hc |
 Too
Big to Ignore: Big Data Too
Big to Ignore: Big Data
Too Big to Ignore: The Business Case for Big Data (Wiley and SAS
Business Series) by Phil Simon. geared towards CIOs, CEOs,
presidents, and IT professionals. At a high level, the book makes a
compelling business case for that which we are calling Big Data. Simon
provides commonsense advice for organizations. ... Think Big!"
$34 256 pages. |
 Data
Science for Business Data
Science for Business
Data Science for Business: What you need to know about data mining and
data-analytic thinking by
Foster Provost and
Tom Fawcett. Based on an
MBA course Provost has taught at New York University over the past
ten years, Data Science for Business provides examples of
real-world business problems to illustrate these principles. $31 |
 Predictive
Analytics Predictive
Analytics
Predictive Analytics: The Power to Predict Who Will Click, Buy, Lie, or
Die by Eric Siegel and Thomas H. Davenport. "Rather than a "how to"
for hands-on techies, the book entices lay-readers and experts alike by
covering new case studies and the latest state-of-the-art techniques."
320p; $18 |
 Doing
Data Science Doing
Data Science
Doing Data Science: Straight Talk from the Frontline by Cathy O'Neil
and Rachel Schutt. Topics include "Statistical inference,
exploratory data analysis, and the data science process; Algorithms;
Spam filters, Naive Bayes, and data wrangling; Logistic regression;
Financial modeling; Recommendation engines and causality; Data
visualization." Based on Intro to Data Science class. $27 |
 On
Being a Data Skeptic On
Being a Data Skeptic
By Cathy O'Neil. "The right approach to data is skeptical, not
cynical––it understands that, while powerful, data science tools often
fail. Data is nuanced, and "a really excellent skeptic puts the term
'science' into 'data science.'" The big data revolution shouldn't be
dismissed as hype, but current data science tools and models shouldn't
be hailed as the end-all-be-all, either."
Kindle: Free 256 pages. |
|
|
NEW BOOKS in 2013: BIG DATA--TECHNICAL |
|
 Data
Just Right: Data
Just Right:
Data Just Right: Introduction to Large-Scale Data &
Analytics by Michael Manoochehri.
A "completely practical and indispensable guide for every Big Data
decision-maker, implementer, and strategist." "expert approaches to
managing massive datasets, visualizing data, building data pipelines and
dashboards, choosing tools for statistical analysis." $27
256 pages |
 Statistical
Learning with R Statistical
Learning with R
An Introduction to Statistical Learning: with Applications in R by
Gareth James,
Daniela Witten,
Trevor Hastie and
Robert Tibshirani. Based
on The Elements of Statistical Learning "but at a level accessible to a
much broader audience." "an accessible overview of the field of
statistical learning, an essential toolset for making sense of the vast
and complex data sets" $62 430 pages hc |
 Predictive
Analytics with R Predictive
Analytics with R
Modeling Techniques in Predictive Analytics: Business Problems and
Solutions with R by Thomas W. Miller. [hc] Addresses "segmentation,
brand positioning, product choice modeling, pricing research, finance,
sports, text analytics, sentiment analysis, and social network
analysis." "illuminates the use of cross-sectional data, time series,
spatial, and even spatio-temporal data." $62 |
|
|
[Prior Years] BIG DATA -- EXCEL POWERPIVOT |
|
 PowerPivot
for Excel 2010 PowerPivot
for Excel 2010
PowerPivot for the Data Analyst: Microsoft Excel 2010 (MrExcel
Library) by Bill Jelen. 336 pg "Simple, step-by-step instructions walk
you through installing PowerPivot, importing data, using PivotTables
with PowerPivot, using super-powerful DAX functions and measures,
reporting to print or SharePoint, and a whole lot more. "help you use
PowerPivot to get the right answers" $23 2010 |
 DAX
for Excel PowerPivot DAX
for Excel PowerPivot
DAX Formulas for PowerPivot: A Simple Guide to the Excel Revolution
by Rob Collie. "PowerPivot is a free add-on to Excel ... that allows
users to produce new kinds of reports and analyses that were ...
impossible before, and this book is the first to tackle DAX formulas,
the core capability of PowerPivot, from the perspective of the Excel
audience." $21 239 pg pb. 2012 |
NEW BOOKS in 2013: INFOGRAPHICS &
VISUALIZATION |
|
 Meaningful
Visualizations Meaningful
Visualizations
Data Points: Visualization That Means Something by Nathan Yau.
"focusing on the graphics side of data analysis. Using examples from
art, design, business, statistics, cartography, and online media, he
explores both standard-and not so standard-concepts and ideas about
illustrating data." 320p. $28. |
 Facts
are Sacred: Guardian Facts
are Sacred: Guardian
Facts are Sacred by Simon Rogers, the Editor of The
Guardian/Data. "reveals how data has changed our world and what we
can learn from it." "publishes and analyses seemingly benign data
- released under the auspices of transparency - to bring its readers
astonishing revelations about the way we live now." "extensive
data visualisations" "beautifully illustrated" $20 hc |
 Data
Visualization for Web Data
Visualization for Web
Interactive Data Visualization for the Web by Scott Murray.
"teaches you the fundamental concepts and methods of D3, a JavaScript
library that lets you express data visually in a web browser. Along the
way, you’ll expand your web programming skills, using tools such as HTML
and JavaScript." "easy and fun with this practical, hands-on
introduction" pb $20 |
 Cool
Infographics Cool
Infographics
Cool Infographics: Effective Communication with Data Visualization and
Design by Randy Krum. "More than just using pictures or colorful
charts, infographics create the type of visual representation that your
audience will quickly grasp and remember." "prepares you for creating
compelling infographics for online marketing, business reports, and
presentations..." pb 368 pages $27 |
 WWII
Infographic Guide WWII
Infographic Guide
World War II in Numbers: An Infographic Guide to the Conflict, Its
Conduct, and Its Casualities by Peter Doyle. "uses
color graphics and succinct text to tell the key stories of the battles
that engulfed the globe and affected virtually everyone alive during the
1940s." "see the war set out in numbers; tells the story with a new
certainty..." |
 Infographic
History of the World Infographic
History of the World
The Infographic History of the World by James Ball and
Valentina D'Efilippo. Reviews: Positive: My wife and I
"are both professional historians, and rated it A+". "James and
Valentina present a vast array of complex information in a contemporary
and accessible manner." Negative: "If this was a term paper, Edward
Tufte would grade it 'F'." |
|
NEW BOOKS in 2013: BIG-DATA MARKETING |
 Making
Sense of Consumer Data Making
Sense of Consumer Data
Digital Marketing Analytics: Making Sense of Consumer
Data in a Digital World by Hemann and Burbary.
288 pages "digital marketing analytics is 100% doable, it offers
colossal opportunities, and all of the data is accessible to you." "chop
the problem down to size, solve every piece of the puzzle, and integrate
a virtually frictionless system for moving from data to decision, action
to results!" $29 |
 Marketing
Analytics Marketing
Analytics
Marketing Analytics: Strategic Models and Metrics
by Stephan Sorger. Covers "a wide variety of decision models and
metrics Nearly 400 figures. Step-by-step instructions on market
segmentation, conjoint analysis, and other techniques.
Current examples demonstrating how organizations are applying models and
metrics." $45 498 pages. |
|
 Practioner
Guide to Biz Analytics Practioner
Guide to Biz Analytics
A Practioner's Guide to Business Analytics: Using Data Analysis Tools to
Improve Your Organization’s Decision Making and Strategy by Randy
Bartlett. 256 p. Effectively integrating analytics into everyday
decision making, corporate culture, and business strategy is a
multifront exercise in leadership, execution, and support." Presents
"specialized tools and skill sets required to succeed" $41 |
 Business
Intelligence - Analytics Business
Intelligence - Analytics
Business Intelligence in Plain Language: A practical guide to Data
Mining and Business Analytics by Jeremy Kolb. 66 pg. $7.
"learn about Business Intelligence, Data Mining, Data Warehousing, Data
Discovery, Big Data, Outlier Detection, Pattern Recognition, Predictive
Modeling, Data Transformation and much more" "your practical guide to
understanding and implementing Business Intelligence." |
 Predictive
Business Analytics Predictive
Business Analytics
Predictive Business Analytics: Forward Looking Capabilities to Improve
Business Performance by Lawrence Maisel and Gary Cokins.
Examines how predictive business analytics can help ... understand
business performance based on extensive use of data, statistical and
quantitative analysis, and explanatory and predictive modeling. Written
for senior financial professionals $35 272 pg. |
 Data
Smart: Science for Insight Data
Smart: Science for Insight
Data Smart: Using Data Science to Transform Information into Insight
by John W. Foreman. "Data
science is little more than using straight-forward steps to process raw
data into actionable insight. And in Data Smart, author and data
scientist John Foreman will show you how that's done within the familiar
environment of a spreadsheet." $30 432 pages pb. |
NEW BOOKS in 2013: BIG DATA USING EXCEL |
 Decision
Analytics using Excel Decision
Analytics using Excel
Decision Analytics: Microsoft Excel by
Conrad Carlberg. [pb]
"Overwhelmed by all the Big Data now available to you?" "Using
Microsoft Excel and proven decision analytics techniques, you can
distill all that data into manageable sets—and use them to optimize a
wide variety of business and investment decisions." "Comes with ...
downloadable Excel workbooks." $28 288 pages |
 Marketing
Analytics w. Excel Marketing
Analytics w. Excel
Marketing Analytics: Data-Driven Techniques with Microsoft Excel by
Wayne Winston. "Helping tech-savvy marketers and data analysts solve
real-world business problems with Excel." "shows you how to tap a simple
and cost-effective tool, Microsoft Excel, to solve specific business
problems using powerful analytic techniques—and achieve optimum
results." $35 720 pg |
 Pivot
Table Data Crunching Pivot
Table Data Crunching
Excel 2013 Pivot Table Data Crunching (MrExcel Library) by
Bill Jelen and Michael Alexander. "learn how to generate complex
pivot reports complete with drill-down capabilities and accompanying
charts. Then, you go even further, discovering how to build a
comprehensive, dynamic pivot table reporting system for any business
task or function." $28 432 pages pb. |
 Quant.
Decision Making: Excel Quant.
Decision Making: Excel
Quantitative Methods for Decision Making Using Excel by Glyn
Davis and Branko Pecar. "Authors approach a range of methods,
dividing them into major enterprise functions such as marketing, sales,
business development, manufacturing, quality control, and finance. The
authors illustrate how the methods can be applied in practice."$56 608
pages. |
|
NEW BOOKS in 2013: STATISTICS TEXTBOOKS |
 Communicate
with Numbers Communicate
with Numbers
Essentials of Business Statistics: Communicating With Numbers by
Sanjiv Jaggia and Alison Kelly. "a core statistics textbook that ...
bridges the gap between how statistics is taught and how practitioners
think about and apply statistical methods. Throughout the text, the
emphasis is on communicating with numbers rather than on number
crunching." $160 |
 Teaching
Statistics Teaching
Statistics
How to Raise a Family Using The Concepts of Statistics: A Primer on
Understanding the Complex World of Statistical Models by Dr. Russell
Leo Roberson. Professors focus "too much on the
mathematics.." Proposes "a new model for teaching statistics and a set
of general rules governing how statistical concepts should be studied
and applied." $24 354 pages. |
|
 Understand
Business Stats Understand
Business Stats
Understanding Business Statistics by Ned Freed, Stacey Jones and
Timothy Bergquist. "An intuitive discussion of basic statistical
principles rather than a mathematically rigorous development. They use
simple examples to introduce and develop concepts and procedures." $99
pb |
 Statistics:
Learn from Data Statistics:
Learn from Data
Preliminary Edition of Statistics: Learning from Data by Roxy Peck. "Two unique chapters, one on
statistical inference and another on learning from experiment data,
address two common areas of confusion: choosing a particular inference
method and using inference methods with experimental data." $76
720 pg |
 Advanced
Statistical Methods Advanced
Statistical Methods
Understanding Advanced Statistical Methods (Chapman & Hall/CRC Texts
in Statistical Science) by Peter Westfall and Kevin S. S. Henning.
Teaches students "to think differently not only about math and
statistics but also about general research and the scientific method."
"presents Bayesian methods before frequentist ones." Highly Recommended!
$68 569 pages. |
 Intro
to Stats: Data Analysis Intro
to Stats: Data Analysis
Introduction to Statistics: Fundamental Concepts and Procedures of Data
Analysis by Howard M. Reid. "redefines the way statistics can
be taught and learned." "balances development of critical thinking
skills with application of those skills to contemporary statistical
analysis." STRONG RECOMMENDATIONS. $50 632 pg. |
|
NEW BOOKS in 2013: EPIDEMIOLOGY |
 Epidemiology:
People's Health Epidemiology:
People's Health
Epidemiology and the People's Health: Theory and Context by Nancy
Krieger. "Epidemiology is often referred to as the science of
public health." "Unlike other major sciences, its theoretical
foundations are rarely articulated. While the idea of epidemiologic
theory may seem dry and arcane, it is at its core about explaining the
people's health." "knowledge minimizing inequitable burdens..."
$29 400 pg |
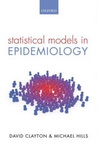 Statistics
Models in Epidemiology Statistics
Models in Epidemiology
Statistical Models in Epidemiology by David Clayton and Michael
Hills. 384 pages "mathematics is deliberately kept at a
manageable level." Shows how "all statistical analysis of data is based
on probability models, and once one understands the model, analysis
follows easily." Based on a highly successful course, this book explains
the essential statistics for all epidemiologists."
$47 REPRINT |
|
NEW BOOKS in 2013: ECONOMETRICS |
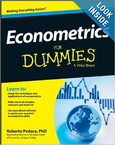 Econometrics
for Dummies Econometrics
for Dummies
Econometrics For Dummies (For Dummies (Business & Personal Finance)
by Roberto Pedace. Studies "the classical linear regression model (CLRM),
which is the foundation of traditional econometric analysis." Studies
"how discrete and restricted dependent variables can create problems for
traditional regression analysis." "Computer outputs from STATA"
$20 360 pgs. |
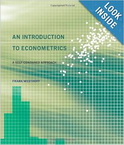 Intro
to Econometrics Intro
to Econometrics
An Introduction to Econometrics: A Self-Contained Approach by Frank
Westhoff. Essentials of probability and statistics" "simple and
multiple regression,.. heteroskedasticity, autocorrelation, large sample
properties, instrumental variables, measurement error, omitted
variables, panel data, simultaneous equations, & binary/truncated
dependent variables. $68 896 pg |
CAUSALITY SYMPOSIUM in 2013 |
 Symposium:
Causality &
Statistics Symposium:
Causality &
Statistics
James
Robins and Thomas Richardson
Single-World Intervention Graphs (SWIGS). Unifying Directed
Acyclic Graphs (DAGs) and Potential Outcomes.
|
Bayes: Why Bother?
Thomas Louis: Design: *Everyone is a Bayesian in
the design phase. *All evaluations are "preposterior,"
integrating over both the data (frequentist act) and the parameters
(Bayesian act). *A frequentist designs to control
frequentist risk over a range of parameter values. *A
Bayesian designs to control preposterior (Bayes) risk. *Bayesian design
is effective for both Bayesian and frequentist goals and analyses. |
NEW DATA SCIENCE TEXTBOOKS-2013 |
 Data
Mining Applications with R Data
Mining Applications with R
.
|
Berlin Numeracy Test
The Berlin Numeracy Test is a fast and flexible
psychometric instrument, validated for use with educated samples from
diverse countries (e.g., college students, computer-literate adults,
physicians). Try out the Berlin Numeracy Assessment at
www.riskliteracy.org/researchers/. |
|
STATS 2011*** |
 Trevor
Butterworth, editor of STATS, contributes to the
Financial Times, Forbes, and the Wall Street Journal. Trevor
Butterworth, editor of STATS, contributes to the
Financial Times, Forbes, and the Wall Street Journal.
ABC's Persecution Of Presidential Award-Winning Scientist Continues.
Pop a tab and pour a lie "white-hat bias: a tendency to
distort information to advance good causes "
More private liquor stores, more alcohol deaths? A.Norton
Top 50 statistics blogs of
2011. |
 Rebecca
Goldin, STATS Director of Research, is on the
Mathematics faculty at George Mason University. Rebecca
Goldin, STATS Director of Research, is on the
Mathematics faculty at George Mason University.
Brilliant ideas from the Washington Post: Learning math
is stupid! Goldin and Merrick.
High Wired: Does Addictive Internet Use Restructure the Brain?
STATS: We want people to
think about the numbers behind the news.
Stats essays for
2011. |
|
StatLit website: New Papers Hosted in 2013 |
|
NEWEST 2013 ARTICLES POSTED TO
STATLIT.ORG
09 Statistical Education:
Steadfast or Stubborn? Schield ASA Audio
6up
09 Get to know variables:
Critical element of statistical analysis J Miller
09 Using Statistics to
Shape Public Opinion
by
A Nelson 6up
09
Key
Components of Numeracy Infusion Course ... Esher Wilder 2013
08 ASA
President's Message: Statistical Literacy ... by Ruth Carver 2012
07 David Moore Page at
StatLit.org with numerous publications.
07 Anne
Hawkins Response to New Pedagogy ...Content by Moore 1997
06
Statistical
Literacy of OB-GYN Residents by
Anderson et al. JGME2013
|
05 Display
Paired Confidence Intervals using Excel by Schield 2013
1
6up
05 Odysseys2Sense:
A Startup Guide Milo Schield 2012 6up Audio
text
05 Effects of Course on Statistical Literacy on Students
Rose Dawson
05 Causality,
Change,
Dichotimizing,
Likert &
Visual Analog Scales Knapp
05 Bias,
N versus (N-1)
Re-visited, To pool
or not to pool Knapp 2013
05 Help
Yourselves (& Public) Know the Truth Vic Cohn Significance1999
04 Statistical
Literacy Serves Police Officers ... by
Irina Soderstrom
03 Scientific
reproducibility: Begley's Six Rules by Booth, Forbes 9/2012
03 New Test for Randomness: Application to Stock Strandberg, Iglewicz
|
|
Statistical Literacy
for Managers @ Augsburg |
 Reinventing
Business Statistics Reinventing
Business Statistics
Schield presented Reinventing
Business Statistics: Statistical Literacy for Managers at MBAA.
6up "Intro Research Statistics should not be required for
Business majors in Management or Marketing." "They need Statistical Literacy for Managers:
critical thinking about numbers in business." "Of all the
core courses, intro statistics is most in need of reinvention." |
Statistical
Literacy using Excel
Using Excel, students (Fall 2013) simulated
runs of a
fair coin,
clusters of
rice,
Law of Very Large Numbers,
von Mises'
Birthday problem, the
Monty-Hall Three-door problem and Marilyn vos Savant's
Four Envelope Problem. Modeled using Chart (linear1Y,
non-linear1Y,
linear2Y and
Linear3factor) and Toolpak (Linear
1Y2X). Created
discrete &
log-normal distributions and
histograms using COUNTIF. Created
sampling distribution of single die.
|
Prediction
Intervals
Prediction intervals are normally based on a mean and a standard
deviation. Yet, standard deviation is seldom used in reporting
stock prices. |
Statistically-Significant Correlations
The formula for the distribution of a
bivariate correlation is complex. See Wikipedia:
Pearson Product-Moment Correlation Coefficient. Examine the
section on INFERENCE. None of these relationships are memorable.
Statistical literacy focuses on memorable relationships.
Schield
(2013) noted that rho = 2/sqrt(n) is a good estimate of the minimum
correlation coefficient that is statistically significant for a given
sample size. This formula is simple, memorable and slightly
conservative for n > 10. |
|
Making
Statistics More Effective in Schools of Business |
 Decision
Sciences Meeting Decision
Sciences Meeting
Making Statistics More Effective in
Schools of Business (MSMESB) fielded over a dozen sessions at the 2013
annual meeting of the Decision Sciences Institute (DSI).
Robert Andrews
(Virginia Commonwealth University) was the key organizer, the chair of
several sessions and the MSMESB webmaster.
2013 MSMESB DSI SIG Report.
Local copy
Keith Ord: What is AP Statistics?
Slides |
 Business
Analytics: Business
Analytics:
John McKenzie (right): Introducing Big Data in Stat101 with small
changes.
Slides
Kirk Karwan: Creating Analytics Class at Furman.
Slides
Kirk Karwan: Analytics Curriculum.
Slides
Satish Nargundkar: Georgia State Analytics.
Slides
James R Evans: Spreadsheet Analytics.
Slides
Robert Stine: Big Data Implications for intro stats.
Slides |
|
 Levine,
Szabat and Stephan Levine,
Szabat and Stephan
David M. Levine
(Baruch College: CUNY),
Kathryn Szabat
(LaSalle University) & David Stephan
(Two Bridges Instructional Technology) presented A Course in Data
Discovery & Predictive Analytics.
Slides.
Presents general principles of using big data and data discovery;
includes a detailed week by week list of topics and recommended software
for the course. |
 Mark
Berenson Mark
Berenson
Statistics Course for Big Data & Analytics.
slides
Big Data Implications for Stat Analysis & Instruction
slides
"The time has come for AACSB-accredited
undergraduate programs to include a core-required course in Business
Analytics as a sequel to a course in Business Statistics." |
|
Introductory Statistics
Webster West: What Should We Teach in an
Intro Stat Course?
slides
Amy Phelps: Write What? I thought this was a Math class.
Slides
Mark Eakin: Simplifying Framework
for an Intro Stats Class.
Slides |
Other Topics
Norean Sharpe: Does AP Exam Credit Have an Impact on GPA?
slides
Aric LaBarr: Analytics Education and the
Evolving Workforce
Slides
M Gisela Bardossy: Mini-Cases using Baltimore Neighborhood Alliance
Indicators
slides |
|
UK Statistical Publications:
2013 |
 Significance (RSS/ASA)
Vol 10 #6 Significance (RSS/ASA)
Vol 10 #6
** Big data and big business:
Should statisticians join in? David Walker [No] and Kaiser Fung
[Yes].
**
Have London’s roads become more dangerous for cyclists?
Jody Aberdein and David Spieghalter.
** What happened when the legal status of cannabis was
reclassified? [Natural experiment] Ian Hamilton. |
 Teaching
Statistics: Teaching
Statistics:
*
Using context to classify variables (pages 29–31 Lawrence M.
Lesser.
**
The danger of dichotomizing continuous variables: A visualization (pages
78–79) by Oliver Kuss
**
Weighted Means Through the Looking Glass (pages 103–106) by
Ruma Falk and Avital Lavie Lann |
|
Statistical Education Journals in 2013 |
|
 CHANCE
Magazine:
Using
Differential Comparisons in Observational Studies by Paul
Rosenbaum. CHANCE
Magazine:
Using
Differential Comparisons in Observational Studies by Paul
Rosenbaum.
"Differential comparisons are easy to do, are quite intuitive, are
supported in a specific way for a specific purpose by statistical
theory, and are-at worst-a harmless and transparent supplement to
standard comparisons of people who look similar. Yet, differential
comparisons are rarely done." |
 SERJ
12:2.
Role
of Context SERJ
12:2.
Role
of Context
Exploring the Role of Context in Students' Understanding of Sampling
by
Jacqueline Wroughton (left), McGowan, Weiss, and Cope. Analyzed "effects of confirmation bias
about sampling."
Students rely "on personal experience and belief instead of principles learned in their course." SERJ
Nov 2013, 32-58. |
|
 Journal
Statistics Education Journal
Statistics Education
An
Applet for the Investigation of Simpson’s Paradox by Kady Schneiter
(right) and Jürgen Symanzik (Utah State) This applet facilitates
the investigation of Simpson’s Paradox. It builds on the
Baker-Kramer graphical representation for Simpson’s Paradox. This applet
is used in an intro statistics class. Student responses are
evaluated. [Ed. Check out
Statlets] |
American
Statistician
Understanding Simpson's Paradox
by
Judea Pearl.
Simpson's paradox is often presented as a compelling demonstration of
why we need statistics education. First I summarize the history of
Simpson's paradox.... Next I ask what is required to declare the paradox
"resolved," and argue that modern understanding of causal inference has
met those requirements. The American Statistician, Vol. 68(1):
8--13, 2014. |
|
OTHER JOURNAL ARTICLES in 2013 |
|
Statistical Literacy and Statistics
Pierce
& Chick (2013). Workplace statistical literacy for teachers:
interpreting box plots. MERJ
A. Agresti, C Franklin
(2013). Art and science of learning from data. |
Simpson's Paradox
Simpson's
paradox in psychological science: a practical guide. By Rogier A.
Kievit, Willem E. Frankenhuis, Lourens J. Waldorp, and Denny Borsboom.
Frontiers in Psychology, 4, 513. |
|
ISI World Conference
in 2013 |

ISI
2013: International
Statistical Institute (ISI) held the 2013 World Statistics Conference in
Hong Kong on 25-30 August. Theme: Making Change Happen.
Detailed Program
Issues and challenges of statistical literacy in higher
education by Peter Kovacs (Hungary).
"statistical literacy -- several successive levels: · 1) general
statistical literacy, i.e. the literacy expected from common people,
combined with elementary statistical language. (we can read statistics).
2) the level of the users of statistics, (a competent attitude. 3) the
expert professional" |
 Two
Major Themes of Analysis Two
Major Themes of Analysis
Challenging the state of the art in post-introductory
statistics by Tintle (right), Chance, Cobb,
Rossman, Roy, Swanson & VanderStoep, "Confounding and
Variation -- Two substantial hindrances to drawing conclusions from
data" "the two major themes of statistical analysis"
"the concepts of confounding and variation are multivariable concepts
that students should deepen their understanding of, and that models are
a tool to provide that enhanced understanding."
"We will (1) Lay out an alternative conceptual goal of a
second course in Statistics—to enhance students’ understanding of
confounding and variability through an approach which is not
model-centered, but is instead, meaning-centered, (2) Present an outline
for a curriculum that places conceptual understanding of variability and
confounding at the center," |
 Developing
Statistical Literacy Developing
Statistical Literacy
1: Statistical
literacy and multivariate thinking by James
Nicholson (left),
Jim Ridgway, Sean McCusker.
Abstract
2: Connected worlds: Statistical literacy in art,
science, public health and social issues by Neil Lutsky. Abstract
3:
Emerging trends in data visualisation: Implications for
producers of official statistics by
Alan Smith.
Exam results and riots: Teaching sociology via authentic contemporary
data. Jim Ridgway, James Nicholson, Sean McCusker.
Abstract |
 Visualizing
Statistics Visualizing
Statistics
1:
Seeing is believing? Kate
Richards (right), Neville Davies, G. Parkinson and D. Martignetti
"examples of poor and misleading graphs and charts ... taken from the
world of business and finance while others are generated from data
captured from learners ... in the International CensusAtSchool Project
2: On visualising our way around road blocks by Chris Wild
Abstract
3: Data
visualisation and statistics from the future Theodosia Prodromou |
ISLP: Promote Statistical
Literacy to Youth
1:
Promoting
statistics to youth through the International Statistical Literacy
Project (ISLP) by Sharleen Forbes, Pedro Campos and Reija Helenius
2:
Statistics under 21 by Marina
Peci
3:
Statistics are interesting - How do we get youngsters
inspired?, K. Soinne
4:
Radical statistics: Teachers and students on the highwire
by Bruno de Sousa, Dulce Gomes, Regina Bispo and Elisa Duart |
Statistical inference – unresolved issue
1:
Informal inferential reasoning: A computer-based training
environment by Joachim Engel, Tim Erickson
2:
Role of statistical inference in teaching and achievement of
students by Ramesh Kapadia.
3:
Teaching statistical inference from multiple perspectives
integrating diverging schools of inference by Ödön Vancsó.
4:
A comparative educational study of statistical inference by
Manfred Borovcnik [Ed. Excellent historical review]
|
|
Evidence evaluation for multivariate discrete data
by Colin Aitken &
Erica Gold.
|
Between media
datalization and statistical literacy: China's logic by Zhongliang
Zhang, Weizi Zhang. The authors argue that "without
statistical literacy as a prerequisite, the room for media datalization
to play a role will be greatly narrowed down; and without the existence
of the media datalization, the efforts to improve statistical literacy
will be tremendously limited." |
|
IASE: 2013 |
 IASE
2013: The International Association for
Statistics Education (IASE) held a satellite conference in Macao. Theme: Stats Education for Progress.
~250+ attendees. IASE
2013: The International Association for
Statistics Education (IASE) held a satellite conference in Macao. Theme: Stats Education for Progress.
~250+ attendees.
Keynote: Open
Data, Official Statistics and Statistics Education: Threats and
Opportunities for Colloration: Jim
Ridgway (left), Durham Univ., UK; Mr. Alan Smith, Office for
National Statistics, UK. "There is an urgent need to rethink the
statistics curriculum, and the development of statistical literacy.
Statistical literacy involves a wide variety of skills and
dispositions." (Continued)
Photos: http://www.flickr.com/photos/101716984@N04/9740606618/ |
Ridgway & Smith
(Continued): "In the
context of Open Data and Big Data, these include a sophisticated
approach to data provenance (e. g. awareness of potential problems with
metadata; plausibility of data), and to measurement (including the
politics of measurement).
The technical content in curricula also
needs to be reviewed. For example, the logic of the analysis of large
scale multivariate data sets is rather different from the logic of
drawing inferences from small samples that are then applied to
populations. Key activities for analysis are: assessing effect sizes;
looking for (non-linear) functional relationships; and mapping
interactions. Statistical ideas that require more curriculum emphasis
include: modelling functional relationships; confidence intervals;
effect size; and Simpson’s paradox." |
 Promoting
Statistical Literacy Promoting
Statistical Literacy
2.1.1
Challenge for the ISLP Project: Promotion of Statistical Literacy and
User Skills Worldwide through a Co-Operation Network: Reija Helenius
(left), Statistics Finland
2.3.1
Promoting Statistical Literacy among Students : Vivian W. Y. Chan,
Census & Statistics Depart, Hong Kong
2.3.2
Statistical Literacy: Bringing Concepts to Life in our Diverse and Ever
Changing User Communities - the Experience of the Australian Bureau of
Statistics : Jonathan Palmer, Australian Bureau of Statistics.
2.4.1
Another Brick in the Wall - Improving Statistical Literacy in Ireland
: Steve MacFeely, Central Statistics Office, Ireland
2.4.3
Increasing Statistical Literacy through Cooperation between National
Statistics Offices and Universities: A New Zealand Experience : John
A. Harraway, University of Otago, New Zealand |
 2.5.3
iNZight into Time Series and Multiple-Response Data : Chris Wild
(left),
Univ. of Auckland, New Zealand 2.5.3
iNZight into Time Series and Multiple-Response Data : Chris Wild
(left),
Univ. of Auckland, New Zealand
2.2.2
Integrating the Use of Official Statistics in Mainstream Curricula
through Data Visualisation : James Nicholson, Durham University, UK
2.7.1
Surveys and Blaster Scatterplots at Middle School Math Nights : Adam
Molnar, University of Georgia, USA
2.7.5
Statistical Significance and Practical Significance in Statistics
Education : Pranesh Kumar, University of Northern British Columbia,
CA
1.2.1
Enthusing Students Towards Statistical Literacy Using Transformative
Learning Paradigm: Implementation and Appraisal by Shirlee Ocampo,
De La Salle University, the Philippines
2.5.2
Statistical Literacy Hatching : Leticia Ruiz, National Institute of
Statistics and Geography, Mexico |
|
USCOTS
in 2013 |
 USCOTS
2013 USCOTS
2013
United States Conference On Teaching
Statistics (USCOTS) 2013 was held at Embassy Suites Hotel & Conference Center
Raleigh-Durham (Research Triangle), North Carolina on May 16th - 18th. Theme: Making Change Happen.
|
 Changing
Times Changing
Times
Changing Times call for Changing
Stats. (1up Slides) by Danny Kaplan: Causation is often the issue. But ... Confounding is common,
Adjustment provides insight if not proof." Adjustment "is very common
in the literature. We should change: (1) Prepare
students for technical computing. (2) Mathematics should be about
multiple variables. (3) Make modeling central." |
Opening Session: Horton,
Stangl and Gould
Nicholas Horton:
Helping Students grasp the true
promise of statistics. What students need to know: CONFOUNDING!
Change: Rethink datasets that motivate our courses; Move from k = 2 to
at least k = 3; Communicate the excitement of statistics (or at least
give a glimpse...)
Darlene Stangl:
Time for a paradigm Change: Why and How to Teach
Students to be Bayesians. Best way to decide upon action is
setting up a decision table that reflects the utility of alternative
actions. Bayesian thinking demands coherency, via explicitly
and transparently laying out our decision table, adjusting the decision
table to the context of the problem at hand, and declaring openly to
others the probabilities we use in reaching a decision. This is why we
must teach undergraduates to think as Bayesians.
Rob Gould:
5
epiphanies that lead me to change (in no particular
order).
#1. It is my fault if students didn't learn.
#2. Clickers. Make clicker questions that turn lectures into
discussions.
#3. Fathom. Everyone can (and should) analyze data
Teaching statistical literacy means teaching data
analysis
#4. Creation of a major
#5: Statistics is important. |
Closing Session: George Cobb
Conclusions:
1. TYRANNY OF THE COMPUTABLE: How we think, and what we teach, are
shaped by what we can and cannot compute.
2. THE POWER OF SIMULATION: Simulation reduces computing areas and
probabilities to counting # Yes / # Reps.
3. FISHER’S VISION: Fisher wanted to base p-values on randomization, but
he didn’t have the computing power. We do.
4. BAYESIAN INTERVALS: Only Bayesian intervals condition on all the
data, and only on the data we actually observed.
5. SIMULATION FREES US TO TEACH WHAT REALLY MATTERS: It’s not just
p-values and Bayesian posteriors. We need more time on what Nick
Horton and Danny Kaplan talked about yesterday.
6. THERE IS NO STATISTICAL GRAND THEORY OF EVERYTHING:
We need
both p-values for model choosing (Does x have a detectable effect?)
AND
Bayesian intervals for estimation (once we have a tentative model). |
|
ASA: Statistical Literacy Session
in 2013 |
 Statistical
Literacy 2013 Statistical
Literacy 2013
Milo Schield organized and
chaired the 16th
topic-contributed session on Statistical Literacy with
50 attendees at the JSM in Montreal, Ontario. Unfortunately only
14 submitted reviews (15 required for judging), so none of our papers
qualified for best-speaker award. Schield's paper ranked #4 out of
35. |
 Get
to Know Your Variables Get
to Know Your Variables
Jane Miller (Rutgers)
presented Getting to know your
variables: A critical element of a statistical analysis.
"Because concepts, context, and study design all affect the valid range
and interpretation of ... those variables, it is
important that students .. get to know each of their variables before analyzing their data."
6up
1up
Audio |
 Relevance
of Rhetoric Relevance
of Rhetoric
Joel Best presented The Relevance of
Rhetoric to Statistical Literacy. Best presents quantitative
arguments advanced by conservatives (healthcare) and by liberals
(welfare) that sound plausible. Best finds a common weakness in
both. He argues that educators need to focus more on quantitative
rhetoric -- how statistics are used - or misused - in everyday
arguments.
|
 Challenging
Statistical Claims Challenging
Statistical Claims
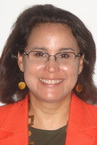
Rose Martinez-Dawson (Clemson) presented Challenging Statistical Claims
in the Media Course and Gender Effects. Goal: "Evaluate
students’ questions (challenges) concerning statistics encountered in
everyday life and how these challenges differed before/after taking
a course focused on statistical literacy.
6up 1up
Audio |
 Stat
Ed: Steadfast or Stubborn? Stat
Ed: Steadfast or Stubborn?
Milo Schield (Augsburg College) presented
Statistical Education: Steadfast or
Stubborn. He argued that statistical education had resisted calls
for change from its leaders over the past 60 years and was closer to a
math-stat course than to a context-based statistics course. He
presented ways in which context could be shown to influence statistical
significance. 6up
1up.
Audio |
 Numeracy
Infusion Components Numeracy
Infusion Components
Ester Wilder (Lehman)
presented
A Numeracy Infusion Course for Higher Education ... to Train Faculty. (1) QR and Making
Numbers Meaningful; 2) QR Learning Outcomes; 3) The Brain, Cognition and
QR; 4) QR and Writing; 5) Discovery Methods; 6) Representations of Data;
7) QR Assessment; and 8) QR Stereotypes & Culture. 6up.
|
|
ASA Related Papers
in 2013 |
Published Papers
Here are statistics on those papers published in the ASA-JSM
Proceedings. Five papers including "confound" in their title or abstract
(two of these are Schield and Pearl). Eight papers included
"statistical literacy" in their title or abstract (one of these is
Schield). 52 included the phrase "caus" (e.g., cause, causal,
etc.) |
 Mathematics
of Causal Inference Mathematics
of Causal Inference
This paper by Judea Pearl "reviews
concepts, principles and tools that have led to a coherent mathematical
theory of causation based on structural models. The theory provides
solutions to a number of problems in causal inference, including
questions of confounding control, policy analysis, mediation, missing
data and the integration of data from diverse studies." |
 Fusion
in Big Data Fusion
in Big Data
Fusion
and causal analysis in big marketing data sets by Igor Mandel (Telmar
Group). "Purpose of ascription (fusion) is to merge information of two
datasets into one, in a such a way, that external criteria are
satisfied." "Individual and statistical causes ... could be looked
at under different angles, and mixing these is, maybe, the main source
of confusion in literature." [Editor. An excellent paper] |
 Visualize Economic Indicators Visualize Economic Indicators
Dynamic Visualization of Economic Indicators by Katherine (Jenny)
Thompson (US Census Bureau). This report presents the ongoing efforts at
the U.S. Census Bureau to develop and implement a standard set of data
visualization tools for usage with its monthly and quarterly economic
indicators. |
 Assumptions
and Benford's Law Assumptions
and Benford's Law
Reality
Checks for a Distributional Assumption: The Case of “Benford’s Law”
by William Goodman. Demonstrates that while Benford’s-like patterns are
indeed common, Benford's per se is not a unique and universal template
for all cases of interest to fraud investigators. "Reminds
us of how, in general, distributional assumptions can sometimes be
overlooked or fail to be critically questioned." |
Uses
of Convenience Samples
Assessing Limitations and Uses of
Convenience Samples: A Guide for Graduate Students by
Kriska et. al.
"This poster takes the view that all samples of human participants are
convenience samples to some degree." "Because some convenience samples
may be better than others, this poster session will examine factors and
issues in sample selection." |
GENERAL INTEREST NEWS IN 2013 |
-
2013 Oct 25:
Numeracy, Medicine, and Healthcare Talk at Lehman College.
Jessica S. Ancker, M.P.H., Ph.D., is an assistant professor in the
Center for Healthcare Informatics and Policy at Weill Cornell
Medical College in New York City. She uses quantitative and
qualitative methods to study how health technology affects
decisions, behaviors and outcomes. Dr. Ancker earned her BA from
Harvard University, and both her M.P.H. and Ph.D. from Columbia
University. In her research, Dr. Ancker studies the use
of health information technology by patients and providers, its
effects on medical decision making, and more broadly, its effects on
public health. She is also interested in issues of health illiteracy
and numeracy among patients, as well as statistical literacy among
providers. She is the author or co-author of more than 30
articles/book chapters including, “Rethinking Health Numeracy: A
Multidisciplinary Literature Review” and “Consumer Experience with
and Perceptions of Health Information Technology” (both published in
the Journal of the American Medical Informatics Association). This
talk is sponsored by the Lehman College Quantitative Reasoning (QR)
Program.
Carman Hall B08: 10 - 11:30 AM.-
2012 Oct 11:
Don’t Panic - The Truth About Population by Hans Rosling (BBC).
"Uses the 3D holographic projection
system Musion which allows Rosling to interact with vast datasets
as-live in front of a studio audience, a first for factual
television."
-
2012 Oct 6:
Financial Literacy Beyond the Classroom by Richard H. Thaler. -
2013 Aug.
Interview with David Moore by Allan Rossman and E. Jacquelin
Dietz. On statistics education
for undergraduates (majors or not) and perhaps secondary school
students: "little of real
substance has changed in the past 20 years, the 1997 advent of AP
Statistics being the most significant exception." Journal of
Statistic s Education, Volume 21 , Number 2 (2013 ).-
2013 July 16. New book: The Norm
Chronicles: Stories and numbers about danger by
Blastland and Spiegelhalter.
-
2013 July 10.
Statistical Literacy for Schools
by Diane Coyle (UK). "I
don’t think basic statistical literacy is included in the new
curriculum for English primary schools – a shame when there’s
evidence everywhere of its absence."
Copy-
2013 June 27. StatLit.org
adds new page for popular author Uri Bram.
Check out his recent books: Thinking Statistically and The
Game Theory. Read about his forthcoming book: Everyday
Statistics.
-
2013 June 12.
Questions Arise About Need for Algebra 2 for All.
Debate over the subject's relevancy brews even as the common
standards expect students to master that content.
Copy-
2013 May 17.
New core curriculum for Texas higher education.
Six core objectives: Critical Thinking Skills,
Communication Skills, Empirical and Quantitative Skills (the
manipulation and analysis of numerical data or observable facts
resulting in informed conclusions), Teamwork, Social Responsibility
and Personal Responsibility.
Draft of new framework.
Comparison. See also
Fewer math courses in
new Texas school core. The new framework requires each
course within the curriculum to address at least three of the six
total objectives, such as critical thinking and communication, as
mandated by the state of Texas. Hinckley said the biggest difference
between the old core and the new changes will be that some courses
will have fewer options. Also, fewer math courses will satisfy the
curriculum requirements. More math course pathways will likely open
up for students. “Specifically, most students take college algebra
at present. Within a few years, we likely will see more liberal arts
majors take statistics to satisfy the math requirement,” Hinckley
said. Copy
-
2013 May 13.
Stats and Stories: a
radio program/podcast involving news and numbers.
By John Bailar and Richard Campbell (director of the journalism
program at Miami University in SW Ohio). "Our first program on
'Baseball and statistics' ... includes an interview with Jim Albert
(the editor of the Journal of Quantitative Analysis and Sports) and
a package and person-on-the-street interviews produced and conducted
by student reporters (see the “About” page on this website for a
listing of all participants)." "Suggestions for future topics
(and guests) are welcome. Topics should be wide ranging covering
serious and lighter topics..."-
2013 April 14.
Teaching QR at the
University of Michigan
by Joe Howard.
Copy-
2013 April 9.
Statistical Literacy Serves Police Officers in Many Ways
by Dr.
Irina Soderstrom at Eastern Kentucky Univ.
PDF-
2013, April 8 & 11. Street Stats:
Using Real-World Examples to Teach Scientific Literacy across the
Psychology Curriculum by Susan A. Nolan ,
Seton Hall University. 2:30 PM EDT/11:30 AM PDT on Monday
April 8. 1 PM EDT/10 AM PDT on April 11. "Susan Nolan
shares a framework for helping you teach students to think like
scientists. Included are a wide range of sure-fire real-world
examples you can embed across the psychology curriculum—from
introductory classes to capstone courses—as you show students how to
become more proficient in their scientific and quantitative
reasoning." Free one-hour session.
-
2013, March
7.
Statistics2013 promises to be a global celebration.
Professor Ron Wasserstein, Executive
Director of the American Statistical Association and member of the
Statistics2013 Steering Committee, describes some of the highlights.
"The more statistically literate people are, the better it will be
for advancing frontiers of science and helping set policies guided
by data and observation."
Copy -
2013,
Jan 28.
Math course added as college algebra option.
Arkansas adds QR as Algebra alternative for non-STEM majors.
-
2013 Nov 16-19,
DSI-Baltimore.
Decision Analytics — Rediscovering Our Roots.
Baltimore Marriott Waterfront.
Submission Deadlines: April 1, 2013. Refereed papers and
competitions, and mini-conference proposals May 1, 2013.
Abstracts and proposal.
Call for papers. Also Decision Science
Journal of Innovative Education.
-
2013 Oct 31 - Nov 2.
National
Numeracy Network 2013 Annual Meeting. San Diego, CA.
-
2013: August 25-30. 59th
ISI WSC 2013
in Hong Kong.
Invited sessions: IPS019 Sources of influence in developing
statistical literacy (James Nicholson). IPS049 Data visualization
for youth appeal (Will Probert). IPS068 Promoting
statistics to youth through the International Statistical
Literacy Project (Reija Helenius). IPS072 International
contrasts in educational frameworks for teaching statistics to
non-specialists (John Harraway).
Scientific papers
Aug 26 9:00
International contrasts
in educational frameworks for teaching statistics to non-specialists
Sponsored by IASE.
On broadening statistics curricula. Deborah
Nolan.
Abstract
Training undergraduates for successful employment
in a changing environment Murray Cameron, Stephen Bush.
Abstract
Aug 26: 15:30 Sources of influence in developing statistical
literacy. Sponsor IASE; Organizer James Nicholson;
Chair Jim Ridgway.
Statistical literacy and multivariate thinking by James R. Nicholson, Jim Ridgway, Sean McCusker
Abstract
/ Paper
Connected worlds: Statistical literacy in art, science,
public health and social issues by Neil Lutsky
Abstract
/ Paper
Emerging trends in data visualisation: Implications for
producers of official statistics by Alan Smith
Abstract
/ Paper
Aug 27: 13:00 Building on foundation courses in statistics
for client disciplines. Sponsored by IASE.
Challenging the state of the art in post-introductory statistics.
Tintle, Chance, Cobb, Rossman, Roy, Swanson & VanderStoep.
Abstract
> Confounding and
Variation --- Two substantial hindrances to drawing conclusions from
data
> identifying the
two major themes of statistical analysis (confounding and variation)
> introduces
blocking as an explicit way to address confounding (by limiting
within group variability) ...
> We argue that the
concepts of confounding and variation are multivariable concepts
that students should deepen their understanding of, and that models
are a tool to provide that enhanced understanding.
Applied statistics for forensic psychology students.
Denny H. Meyer, Brian Phillips, Joanna Dipnall.
Abstract
Aug 27: 13:00 History II: Pierre Remond de Montmort, Thomas
Bayes, and probability in China
A conjecture on why Bayes did not send off his
Essay by Kai Wang Ng
Abstract
Aug 27: 15:30
Mega-classes in statistics education: A 360
degrees view. Sponsored by IASE.
Thirty five years of mega classes and still evolving by
Jessica Utts
Abstract
Learning statistics in an Australian mega-class - The view from
students, lecturers and researchers by Peter Petocz.
Abstract.
Dealing with mega-classes in an online environment by Kay Lipson.
Abstract.
Mega-classes in statistics education: Establishing a research
framework in a complex domain by Irena Ograjenšek & Iddo Gal.
Abstract
Aug 28, 9:00 Strategies and structures for
student engagement and ownership in statistical learning.
Sponsored by IASE.
Exam
results and riots: Teaching sociology via authentic contemporary
data. Jim Ridgway, James Nicholson, Sean McCusker.
Abstract
Aug 28, 9:00 Data visualization for youth
appeal. Sponsored by IASE, Youth Theme
Seeing is believing? Kate Richards, Neville Davies, Gamma
Parkinson, Dominic Martignetti
Abstract
On visualising our way around road blocks. Chris J.
Wild.
Abstract
Data visualisation and statistics from the future.
Theodosia Prodromou
Abstract
Aug 28, 15:30 Improving statistics teaching: Bringing
statisticians and educators together. Sponsored by IASE
Statistician and statistics educator discuss lessons learned
from cross disciplinary sojourns. Jennifer Kaplan,
Vincent Melfi.
Abstract
Good
practice in using statistics in statistics education research.
Neville Davies, Gemma Parkinson.
Abstract
Working together to improve statistics education: A research
collaboration case study Maxine Pfannkuch, Chris J. Wild.
Abstract
Aug 28, 15:30 Promoting statistics to youth through
International Statistical Literacy Project (ISLP). Sponsor
IASE & Youth Project
Promoting statistics to youth through the ISLP. Sharleen
Denise Forbes, Pedro Campos, Reija Helenius.
Abstract
Statistics under 21. Marina Peci.
Abstract
Statistics are interesting - How do we get youngsters inspired?
Katri Johanna Soinne.
Abstract
Radical statistics: Teachers and students on the highwire.
Bruno de Sousa, Dulce Gomes, Regina Bispo, Elisa Duarte.
Abstract
Aug 29, 13:00 Learning to teach and
assess statistics at the tertiary level. Sponsored by
IASE. Organizer & chair: Bruno de Sousa.
Developing statistics inferential concepts in introductory
courses. Stephanie C. Budgett, Maxine Pfannkuch.
Abstract
Aug 30 13:00 Statistical inference – An unresolved issue
in statistics education. Organiser: M. Borovcnik; Chair : J.
Harraway
Informal inferential reasoning: A computer-based training
environment by Joachim Engel, Tim Erickson
Abstract
The role of statistical inference in teaching and achievement of
students by Ramesh Kapadia. Abstract
Teaching statistical inference from multiple perspectives
integrating diverging schools of inference by Ödön Vancsó.
Abstract
A comparative educational study of statistical inference by
Manfred Borovcnik [Ed. Excellent historical review]
-
2013: August 22-24.
IASE
Satellite to 2013 World Statistics Congress, Macao
Program
Proceedings.
Theme is 'Statistics Education for Progress'; Special sub-theme
(Aug 24) of 'Statistics Education for Progress: Youth and
Official Statistics'.
The first two days will feature papers
proposed by IASE while the third day will involve representatives of
IAOS as well as IASE.
Session 1.1.0 Enthusing the Youth and Teachers. Chair: Iddo Gal,
University of Haifa, Israel
1.1.1
Teaching Introductory Statistics for Evidence-Based Practice:
Integration of Context. Rossi A. Hassad, Mercy College, New
York, USA
* Session 1.2.0 Research and Statistical Education. Chair:
Hang Fai Yeung, University of Macau, Macao SAR
1.2.1
Enthusing Students Towards Statistical Literacy...
Implementation and Appraisal. Shirlee Ocampo, De La Salle Univ.,
the Philippines
Keynote Speech III:
INCENSE: Insights into Inciting Debates
around Census Data. Jim Ridgway, Durham U., UK; Alan Smith, ONS
UK. 9-10:20
*
Session 2.1.0 Building upon Successful Projects. Chair:
Grace Q. Fu, University of Macau, Macao SAR
2.1.1
Challenge ISLP Project: Promotion of Statistical Literacy
...Worldwide through Co-Operation. Reija Helenius,
Statistics Finland
* Session 2.2.0 Learning, Disseminating and Using Official
Statistics. Chair: Ron Wasserstein, American Statistical
Association
2.2.2
Integrating the Use of Official Statistics in Mainstream
Curricula through Data Visualisation. James Nicholson, Durham
University, UK
* Session 2.3.0 Using Official Statistics to Promote Statistical
Literacy. Chair: Peter Petocz, Macquarie University, Australia
2.3.1
Promoting Statistical Literacy among Students. Vivian W. Y.
Chan, Census and Statistics Department, Hong Kong SAR
2.3.2
Statistical Literacy: Bringing Concepts to Life ... - the
Experience of the Australian Bureau of Statistics. Jonathan
Palmer, ABS
* Session 2.4.0 Disseminating Official Statistics into the Real
World of Youth. Chair: Keiko Osaki-Tomita, UN Statistics
Division, USA
2.4.1
Another Brick in the Wall - Improving Statistical Literacy in
Ireland. Steve MacFeely, Central Statistics Office, Ireland
2.4.3
Increasing Statistical Literacy through Cooperation between NSOs & Universities: New Zealand Experience. John Harraway, U.
Otago
* Session 2.5.0 New Initiatives in Official Statistics.
Chair: Peng Chun Vong, University of Macau, Macao SAR
2.5.2
Statistical Literacy Hatching. Leticia Mendoza
Ruiz, National Institute of Statistics and Geography, Mexico
2.5.3
iNZight into Time Series and Multiple-Response Data. Chris
Wild, University of Auckland, New Zealand
* Session 3.3.0 ISLP - Poster Assessment. Chairs: James
Nicholson, Durham U., UK; Patrick K. K. Chu, U. Macau, Macao SAR
2.7.1
Surveys and Blaster Scatterplots at Middle School Math Nights :
Adam Molnar, University of Georgia, USA
2.7.5
Statistical Significance and Practical Significance in Statistics
Education : Pranesh Kumar, Univ. of Northern British Columbia,
Canada -
2013 Aug 4-8.
ASA-JSM
2013 Montreal.
Sunday: Analyses that Inform Policy Decisions are, de
Facto, Causal. Roee Gutman and Donald Rubin, 2:35 PM
Invited
Abstract
The Ethical Practice of Statistics for the Perplexed, Lawrence
Hubert, 4:25 PM.
Abstract
Monday:
Breakfast Roundtables:
* TL03 Introducing Inference in Introductory Courses by William Notz, Ohio State University.
* TL05 Making Causal Inferences from Observed Web Visits by Stephen Iaquaniello, SapientNitro.
------------------
2013 Statistical Literacy Session [10:30 AM
Session 168]:
* Joel Best: The Relevance of Rhetoric to Statistical Literacy.
Abstract
* Jane Miller:
Getting to know your variables:
A critical element of a statistical analysis.
Abstract
1up
6up
Audio.
* Milo Schield:
Statistics Education: Steadfast or Stubborn.
Abstract
6up 1up Audio
[Talk ranked #3 overall out of 35]
* Rose Martinez-Dawson:
Challenging Statistical Claims in
Media Course and Gender Effects.
Abstract
6up
1up
Audio
* Esther Wilder:
Key
Components of Numeracy Infusion Course for Higher Education.
Abstract
6up
1up
Handout
----------------
* Use and Misuse of Observational Data - the Critical Importance
of Sound Study Design, Allen Heller 11:25 AM.
**
Nate Silver: Invited session 4-5:50 PM.
Tuesday:
* Making Causal Inferences from Observed Web
Visits Stephen Iaquaniello 7 AM Roundtable
* TL13 How to Write a Successful Statistics Book by Sophia
Rabe-Hesketh and Anders Skrondal Lunch Roundtable
* The Mathematics of Causal Inference: Use it or Lose it Judea
Pearl 2:05 PM. Medallion Invited Lecture
Abstract
*
Fusion and causal analysis in the big marketing data sets
Igor Mandel 2:50 PM Abstract
* Statistics in Business Schools Interest Group:
Group Business Meeting.
4-5:30, Saint-Francois Xavier, Hotel InterContinental Montréal (I).
Wednesday:
* 7-8:15 AM Roundtable. Introducing
Causal Inference in Statistical Education. Judea Pearl
Abstract
* 7-8:15 AM Roundtable.
WL13 Teaching Soft Skills in the First Business
Statistics by Keith Ord, Georgetown Univ.
* Defining and Estimating Causal Direct and Indirect Effects... Judith J Lok 9:05 AM.
Abstract
* Causal inference in epidemiology using Bayesian methods. Lawrence C McCandless 9:35 AM
Abstract
* The Tale of Two Cities: Mediation and Confounding Tyler J
VanderWeele 2:05 PM. Introductory Overview Lecture
Abstract
Thursday:
* Bayesian Inference for Causal Quantities via
Instrumental Variable Approach 9:50 AM. Sparapani, Laud, Pruszynski
and McCulloch.
Abstract
* Causal Inference with Observational Data with Regression with Discontinuity Design 11:35 AM
Patricia Eckardt
Abstract
-
2013 June 3-7.
Statistical
Literacy Five-day Course • Lawrence, Kansas.
Presented by the Quantitative Training Program of Psychology and the
Center for Research Methods and Data Analysis at the University of
Kansas. Institute Overview: Designed for practitioners. This
course provides a conceptual understanding of both basic and
advanced statistical concepts and issues. Focus is on understanding
and interpreting statistical techniques as commonly applied in the
clinical, educational, social, and behavioral sciences.
Objectives: This course teaches the skills necessary to read,
interpret and translate basic (ANOVA and Regression) and advanced
statistical analyses (Structural Equation Modeling, Multi-Level
Modeling) as referenced in articles, seminars, and other
publications. At the end of this course students will be able to:
•Understand and evaluate published research studies as presented in
the media. •Understand the underlying statistical methods for
research-based training. •Participate in critical conversations with
colleagues about research that informs practice.-
2013
June
Statistical Literacy of Obstetrics-Gynecology residents
by Anderson, Williams and Schlkin.
Statistical Literacy defined as "understanding the statistical
aspects and terminology associated with the design, analysis, and
conclusions of original research."
Copy. -
2013
May 16-18. The 2013 U.S. Conference on Teaching Statistics (USCOTS)
was held in Raleigh, North Carolina.
About Program
Plenary speakers
Workshops
Posters Conference theme: "Making
Change Happen."
Thursday Opening Session: "Igniting a Passion for Change in Teaching
Statistics".
Friday: Plenary Session I Horton and Kaplan, "All Statistics are
Wrong, but Some Statistics are Useful"; Breakout Session I: Kaplan
and Horton: "A Tutorial on Modeling with Multiple Variables",
Saturday: Plenary Session IV: Wild, "The Need for Speed in the Path
of the Deluge."
-
2013 April.
The development of statistical literacy skills in the eighth
grade: exploring the TIMSS data to evaluate student achievement
and teacher characteristics in the United States.
By Jamie D. Millsa and Charles E. Holloway.
Educational
Research and Evaluation: An International Journal on Theory and
Practice Volume 19, Issue 4, pages 323-345 2013
-
2013 March 1.
MBAA
2013 Chicago.
Reinventing
Business Statistics: Statistical Literacy for Managers
by Milo Schield. Operations Management and Entrepreneurship. 6up.
An Analytical Problem-Solving Approach to
Teaching Business Statistics: Moving from Imitation to Thinking.
Mary Ann Shifflett and Timothy Schibik, University of Southern
Indiana.
"The Daily Change in the Dow Is
Random -Should the Media Stop Reporting This Index?
John L. Stedl, Chicago State University.-
2013: Feb
6-10. The Eighth
Congress of the European Society for Research in Mathematics
Education (CERME-8) will take place at Antalya, Turkey. CERME8:
Working Group 5 Stochastic Thinking Leaders:
Arthur Bakker (the Netherlands): a.bakker4@uu.nl Pedro Arteaga
(Spain), Andreas Eichler (Germany), Corinne Hahn (France).
Scope and Focus of WG5: Stochastic thinking refers to statistical
and probabilistic thinking and the combination of both. Statistical
thinking is a key skill for the citizen who needs to interpret
information presented through the media or the workplace, to
contribute to modern society and to interpret scholarly papers. An
important challenge is to develop statistically literate citizens
and meaningful use of statistical tools. An important step forwards
would be to consider bridges between data analysis, probability and
inference and it is in this common ground that we locate stochastic
thinking. Recent developments in technology support (i) dynamic
exploration of data and (ii) experimentation with probabilistic
models as generators of data as well as in exploratory data analysis
or informal statistical inference. However, professional development
of teachers is crucial to keep up with such developments. Important
dates: 15 September 2012: Deadline for submission of papers. 1
October 2012: Deadline for submission of poster proposals. 22
October 2012: Deadline for reviewers to submit their reviews. 1
December 2012: Deadline for revisions to papers.
-
2013
February 1. Statistical Literacy Explained? by
Paul Hewson in Teaching Statistics. "I do like Milo Schield
(2011) “Statistical Literacy” (Fifth Edition) but want to move
beyond that into formal inferential statistical methods.
However, as I want to be very general, I don’t want to use the
GAISE definitions (brilliant as they are) as they are too
focussed on formal education.
-
2013:
Jan 9-12. MAA
JMM at San Diego. Abstracts
Student Success in Quantitative Reasoning, I
Thursday AM
* A Liberal Arts Quantitative Literacy Seminar Becomes an
Institutional Research Team. Jennifer A. Bruce
Abstract
* Teaching Multiple linear regression to business students. Aldo
R Maldonado.
Abstract
Probability and Statistics, III
MAA General Contributed Paper Session. Thursday January 10,
2013, 9:30-11:10.
* The Power Law, or: Just Your Everyday 25-sigma Event... Andrew
Niedermaier.
Abstract
Student Success in Quantitative Reasoning II, Thursday
afternoon. Organizer: Ray Collings, Georgia Perimeter College.
* Quantitative Reasoning through Consumer Finance. Andrew J
Miller*, Belmont University
Abstract.
* Dual Credit for Quantitative Reasoning Courses: What Are the
Challenges? Gregory D. Foley.
Abstract
* Quantway and Statway: Successful Models for Teaching
Quantitative Reasoning. Cinnamon Hillyard and Karon Klipple.
Abstract
* Reverse Engineering a Quantitative Reasoning Course. Bernard L
Madison.
Abstract QL courses judged according to six sets of
criteria...
* Promptless instruments and Habits of Mind: Quantitative
Literacy as an honors course. Dominic Klyve and Stuart Boersma.
Abstract
* Fisher's Test and the Ubiquity of Small Samples. Jeff Suzuki
Abstract
Adding Modern Ideas to an Introductory Statistics Course,
Friday morning. Organizers: Brian Gill, Scott Alberts and Andrew
Zieffler.
* Simulation Illogic Repaired [using Minitab macros]. Patricia B
Humphrey. [Not presented]
Abstract
Adding Modern Ideas to an Introductory Statistics Course,
Friday afternoon. Organizers: Brian Gill, Scott Alberts and Andrew
Zieffler.
* Introducing Big Data in an Introductory Applied Statistics
Course. William Rybolt and John McKenzie, Jr.
Abstract
* Seasonality and Autocorrelation: The typical "problem"
children in business statistics. Joseph P McCollum and Arindam
Mandal.
Abstract
* The New York
Stock Exchange: A Real World Data Set. Robert P. Webber.
Abstract
* Real Data, Real Stakes: Introductory Statistics Students
Predict the Wisconsin Recall Election. Stephen and Jennifer
Szydlik.
Abstract
* Fisher's Test and the Ubiquity of Small Samples. Jeff Suzuki
Abstract
* All the Statistics That's Fit to Print. Penelope H. Dunham
Abstract
Transition from High School to College: Alternative
Pathways, Saturday afternoon. Organizer: Gail Burrill, Michigan
State University Abstract: Should all students be prepared to
take a traditional sequence of calculus courses? If not, what
alternatives provide a mathematically rich, useful, and relevant
experience for students?
* The New Mathways Project: A Statewide Initiative .... Uri
Treisman (UT-Austin and Dana Foundation).
Abstract
* Quantway and Statway: Pathways To and Through a College Level
Math Course. Karon Klipple (Carnegie) and Cinnamon Hillyard.
Abstract
* Alternative Pathways--Entry Level Mathematics Options. Roxy
Peck.
Abstract
* Mathematics, Statistics, and Modeling for College Readiness
and Informed Citizenship. Gregory D. Foley.
Abstract
* Calculus is Hard, Change is Harder. Daniel T Kaplan [Talk
cancelled].
Abstract
|
|
Amazon Best Selling Books:
Statistics 2013 |
|
AS OF 2013
12/2013
Adv. Search: Subject = Science-Math, Keyword = Statistics.
Language=English. Published before Jan 2014. Sort-by =
Best Selling.
Results appear with Sort = Relevance.
Excludes Kindle editions, textbooks, free Creative Commons (CK-12)
books, required "books" (My MathLab) and non-books.
#1 Outliers: The Story of Success by Malcolm Gladwell
#2 Freakonomics Rev Ed. by Levitt and Dubner 2010
#3 Big Data: A Revolution ... by Mayer-Schönberger & Cukier Mar
2013
#4 The Visual Display of Quantitative Information, 2nd ed. by Tufte 2001.
#5 Data Science for Business by Provost and Fawcett Jul 2013
#6 Cartoon Guide to Statistics by Larry Gonick, Woollcott Smith.
#7 World Almanac and Book of Facts 2014 by Sarah Janssen 2013
#8 Naked Statistics: Stripping Dread from Data by Wheelan 2012
#9 Research Design: Qualitative, Quantitative & Mixed by Creswell 2008
10 Fooled by Randomness:
The Hidden Role of Chance by Nassim Taleb.
11 Doing Data Science: Straight Talk from Frontline: O'Neil & Schutt
2013
12 How to Lie with Statistics by Darrell Huff and Irving Geis 1993
13 Lean Analytics: Use Data, Build Better Startup: Croll & Boskovitz
2013
14 Against the Gods: The Remarkable Story of Risk by Bernstein 1998
15 Design and Analysis of Experiments by Montgomery 2012
16 Experimental and Quasi-Experimental Designs for Generalized Causal
Inference by William Shadish, Thomas Cook and Donald
Campbell 2001
17 The Drunkard's Walk: How Randomness Rules Our Lives:
Mlodinow 2009
18 Now You See It: Visualization for Quantitative Analysis: Few 2009
19 Qualitative Research & Evaluation Methods by Patton 2001
20 Intuitive Biostatistics: AGuide to Statistical Thinking: Motulsky
2010
21 Pattern Recognition and Machine Learning by Bishop 2007
22 How to Prove It: A Structured Approach by Daniel J. Velleman 2006
23 Bayes' Rule: A Tutorial Introduction by James V Stone Jun 2013
24 Cartoon Introduction to Statistics by Klein and Dabney Jul 2013
25 Think Bayes by Allen B. Downey Sep 2013 |
Published during 2013
Advanced Search: Subject: Science/Math. Keyword: Statistics. Published
during 2013.. Sort: New and Popular.
Exclude Kindle editions, textbooks and non-books: game
cards,
calendars, Cliff notes, coloring books, GRE/SAT/AP workbooks,
logic puzzles., Mathlab access.
#1 Big Data: A Revolution ... by
Mayer-Schönberger & Cukier
#2 Data Science for Business by Provost and Fawcett
#3 Doing Data Science: Straight Talk from Frontline: O'Neil & Schutt
#4 Applied Predictive Modeling: Max Kyhn and Kjell Johnson
#5 Bayes' Rule: A Tutorial Introduction by James V Stone
#6 Modelling Techniques with Predictive Analytics by Thomas Miller
#7 Cartoon Introduction to Statistics by Grady Klein and Alan Dabney
#8 Lean Analytics: Build Startup Faster by Alistair Croil and B.
Yoskovitz
#9 Intro Mediation, Moderation, and Conditional Process Analysis: Hayes
10 Analyzing Baseball Data with R by Max Marchi and Jim Albert
11 Bad Pharma: How Drug Companies Mislead and Harm by Ben Goldacre
12 Think Bayes by Allen B. Downey
13 Keeping up with the Quants by Thomas Davenport and Jinjo Kim
14 Data Mining Applications with R by Yanchang Zhao and Yonghua Cen
15 Sports Analytics: Guide for ... Decision Makers by Alamar and Oliver
16 Stats and Curiosities from Harvard Business Review by HBR
17 Poor Numbers: Mislead by African Development Stats by Jerven
18 From STEM to STEAM: Using Brain-Compatible Strategies to Integrate
the Arts by David Sousa and
Thomas Pilecki
19 Decision Analytics: MS Excel by Conrad Carlberg
20 Analyzing Social Networks by Borgatti, Everett and Johnson
21 Will you be alive in 20 years -- Probability by Paul Nahin
22 Multivariate Time Series Analysis with R by Ruey Tsay
23 Biostatistics for Dummies by Pezzuilo
24 Who's bigger: Where historical figures really rank by Skiena and Ward
25 High-yield Biostatistics, epidemiology and Public Health by Glaser |
|
Top StatLit
Papers by Google Scholar-As of 2013 |
|
Google Scholar
search for the phrase "statistical literacy": 3,790 entries excluding
patents and citations as of Dec., 2013.
For this list, select if "Statistical
Literacy" in Title.
Total number by Year of Publication: 1951 (1). 1979 (2). 1989
(1). 1992 (1). 1993 (1). 1995 (3). 1997 (3). 1998 (5). 1999 (4). 2000 (8).
2001 (3). 2002 (15). 2003 (13). 2004 (13). 2005 (12). 2006 (12). 2007 (6).
2008 (12). 2009 (3). 2010 (20). 2011 (6). 2012 (1). 2013 (1).
|
RANK |
"--------------------- CITATIONS ----------------------- |
|
2013 |
2013 |
2012 |
2011 |
Article/Book |
|
1 |
406 |
307 |
265 |
I. Gal (2002). Adults' statistical literacy:
Meanings, components, responsibilities. ISR |
|
2 |
165 |
131 |
106 |
K Walman (1993). Enhancing statistical
literacy: Enriching our society.
JASA |
|
3 |
142 |
123 |
100 |
J Watson, R Callingham (2003). Statistical
literacy: A complex hierarchical
construct. SERJ |
|
4 |
134 |
108 |
86 |
DJ Rumsey (2002). Statistical literacy
as a goal for introductory statistics courses. JSE |
|
5 |
105 |
56 |
56 |
D. Ben-Zvi (2004). Statistical literacy,
reasoning, and thinking: Goals, definitions, and challenges. |
|
6 |
98 |
80 |
66 |
D Ben-Zvi, et al. (2004). The challenge of developing
statistical literacy,
reasoning, and thinking. [book] |
|
7 |
65 |
51 |
36 |
I Gal (2005). Statistical literacy.
The Challenge of developing statistical literacy |
|
8 |
48 |
45 |
39 |
Watson & Moritz (2000). Development of understanding of
sampling for statistical literacy.
Jrnl Mathematical Behavior |
|
9 |
44 |
37 |
33 |
J Garfield et al, (2005). Research on
statistical literacy, reasoning, and
thinking.... The challenge … |
|
10 |
40 |
36 |
31 |
J Watson (2005). Developing reasoning about samples. The
challenge of developing statistical
literacy. |
|
11 |
36 |
32 |
30 |
S. Murray and I. Gal (2002). Preparing for diversity in
statistics literacy:
Institutional-educational implications |
|
12 |
31 |
30 |
27 |
I Gal (2003). Teaching for statistical
literacy and services of statistics
agencies. American Statistician |
|
13 |
30 |
25 |
23 |
I. Gal (2002). Statistical literacy:
Conceptual and instructional issues. Perspectives on adults
learning mathematics |
|
14 |
30 |
28 |
23 |
M. Schield (1999). Statistical literacy:
Thinking critically about statistics.
APDU: Of Significance |
|
15 |
29 |
28 |
24 |
M. Schield (2004). Statistical literacy
curriculum design. IASE Curriculum
Design Roundtable. |
|
16 |
28 |
|
15 |
M. Schield (2004). Information literacy,
statistical literacy and data
literacy. IASSIST |
|
17 |
28 |
25 |
22 |
R. Callingham, J. Watson (2005). Measuring
statistical literacy. Journal of
Applied Measurement |
|
18 |
24 |
23 |
22 |
I Gal (1995). Statistical Tools and
Statistical Literacy: The Case of the
Average. Teaching Statistics. |
|
19 |
24 |
|
|
I. Gal (2003). Expanding conceptions of
statistical literacy. SERJ |
|
20 |
24 |
|
|
M Schield (2006). Statistical Literacy:
Reading graphs and tables of rates and percentages |
|
21 |
24 |
|
14 |
M. Schield (2002). Statistical literacy survey analysis:
Reading tables and graphs of rates and percentages |
|
22 |
23 |
|
|
K. Bessant (1992). Instructional design and development of
statistical literacy. |
|
23 |
22 |
|
|
Hellems et al (2007). Statistical literacy
for readers of Pediatrics: a moving target |
|
24 |
22 |
|
|
M. Schield (2010). Assessing statistical
literacy: Take CARE. In Assessment
Methods… book. |
|
25 |
20 |
|
|
DG Haack (1979). Statistical literacy:
A Guide to Interpretation. Book. |
|
26 |
19 |
|
|
M. Schield (2000). Statistical literacy:
difficulties in describing and comparing rates and percentages |
|
27 |
18 |
|
|
Snell (1999). Using Chance media to promote
statistical literacy |
|
28 |
17 |
|
|
JM Watson (2004). Statistical literacy:
From idiosyncratic to critical thinking |
|
29 |
16 |
|
|
Anyama & Stevens (2003). Graph interpretation aspects of
statistical literacy:
A Japanese perspective |
|
30 |
15 |
|
|
J. Moreno (1998). Statistical literacy:
statistics long after school |
|
31 |
15 |
|
|
JL Moreno (2002). Toward a statistically
literate citizenry: What statistics
everyone should know |
|
32 |
15 |
|
|
M. Schield (2002). Three kinds of
statistical literacy: What should we
teach |
|
33 |
14 |
|
|
JM Watson (2003). Statistical literacy
at the school level: What should students know and do |
|
34 |
14 |
|
|
M. Schield (2004). Statistical Literacy
and liberal education at Augsburg College [citation] |
|
35 |
13 |
|
|
Lehola (2003). Promoting statistical
literacy: A South African perspective |
|
36 |
13 |
|
|
P. Cerrito (1999). Teaching statistical
literacy |
|
37 |
11 |
|
|
JM Watson (1995). Statistical literacy:
A link between mathematics and society |
|
38 |
10 |
|
|
Carmichael & Cunningham (2003). Factors Influencing … Students'
Interests in Statistical Literacy |
|
39 |
10 |
|
|
Gelman et al. (1998). Student projects on
statistical literacy and the media |
|
40 |
10 |
|
|
JM. Watson (1998). The role of statistical
literacy in decisions about risk:
Where to start |
|
41 |
10 |
|
|
Watson & Kelly (2000). The vocabulary of
statistical literacy |
|
42 |
9 |
|
|
Ridwgway et al. (2008). Mapping New Statistical Iliteracies and
Literacies |
|
43 |
8 |
|
|
M. Schield (1998). Statistical literacy
and evidential statistics |
|
44 |
8 |
|
|
Monahan (2007). Statistical Literacy
A Prerequisite for Evidence-Based Medicine |
|
45 |
8 |
|
|
Watson & Nathan (2010). Assessing the interpretation of
two-way tables as part of statistical literacy |
|
46 |
7 |
|
|
D. Trewin (2005). Improving statistical
literacy: The … roles of schools and
the National Statistical Offices |
|
47 |
7 |
|
|
DJ Rumsey (2002). Statistical literacy:
Implications for teaching, research, and practice |
|
48 |
7 |
|
|
Kurtz et al. (2008). Using models and representations in
statistical contexts:....sub-competency of statistical literacy |
|
49 |
7 |
|
|
M. Schield (2000). Statistical literacy
and mathematical reasoning |
|
50 |
7 |
|
|
R. delMas (2002). Statistical literacy,
reasoning, and thinking: A commentary |
|
|
TOP
DOWNLOADS @ STATLIT.ORG in 2013 |
|
PDFs downloaded from
www.StatLit.org in 2013.
Total downloads: 265,000 in 2013; 246,000
in 2012; 198,000
in 2011; 207,000 in 2010; 184,000 in 2009; 106,000 in 2008..
Counts in parenthesis are (2013; 2012; 2011; 2010; 2009; 2008).
As of Dec. 2013, the StatLit
website hosted 1,114 pdfs: 787
papers and 327 slides.
-
Percentage
Graphs in USA Today. Milo Schield 2006 ASA Proceedings. (7771;
17,819;
19,114;
11,179; 13,253; 14,247; 8809) Total:
93,216.
-
Statistical Literacy: Uses & Abuses of Numbers by Andrew Nelson
6up
(4,912)-
Presenting Confounding Graphically Using Standardization
by Milo Schield. 2006 STATS magazine. (3709 [11];
4646;
1289; 2084; 1985; 1616). Total: 15,329.
-
Statistical
Literacy: A New Mission for Data Producers by Milo Schield. 2011
SJIAOS (3104 [8]; 2815 [10]; 1723). Total: 7,642 -
Univ. Texas San Antonio: Quantitative Scholarship - Final Draft
Press release 2009 (1896 [4]).
-
Statistics for Political Science
Majors. Gary Klass 2004 ASA (1817; 1416[10]; 1389[10]; 596[6]; 765; 215) -
Interpreting the substantive significance of multivariate
regression coefficients. Jane Miller 2008 ASA
(1,630 [9]; 3,118; 1625[11]; 2094; 1412).-
Interpreting the Cumulative
Frequency Distribution of Socio-Economic Data. Othmar Winkler
2009 ASA [1,515 [11]; 822[7], ) -
Random Sampling
versus Representative Samples by Milo Schield. 1994 ASA.
(1,328) [This was the first paper given by Schield at JSM.
In the Q&A following his talk, the first respondent said "I have authored
many papers in statistics, and I maintain that you, Sir, are undermining the
theoretical foundations of our discipline". The next respondent said
"This is good paper; we need more of this kind of thinking."]
-
Assessing
Students’ Attitudes: The Good, the Bad, and the Ugly by
Anne Millar and
Candace Schau 2010 ASA. (1,024 [6]) -
Coincidence in Runs and Clusters. Milo
Schield 2012 MAA (915 [5]; 2,466[9]) -
Making Statistics Memorable: New Mnemonics and Motivations by Larry
Lesser. ASA 2011. (900 [8]).
DeepMetrix tracks the top 25 files downloaded each month from
StatLit.org. Very few files appear in the top 25 all 12 months.
The number of months tracked is in brackets [#] if less than 12. |
-
Exploring Simpson's Paradox. Larry Lesser (Univ. Texas, El Paso) NCTM
2001 (813 [6]; 1,686[9]; 1143[9]; 2043[11]; 2844; 913)
-
Statistical Literacy Curriculum Design, 2004
Milo Schield IASE (760 [6]; 457[2])
-
Social Mathematics in US Civics
Curriculum. James Mauch
dissertation 2005 (759 [5]; 801[4]; 792[5]; 858[7]; 442; 470)
-
Statistical Literacy and Chance by Milo
Schield. 2005 ASA 6up
(747[5]) -
Toward a Clearer
Definition of Confounding by Clarice Weinberg. 1993 American
Journal of Epidemiology (676 [5]) -
Statistical
literacy in adult college students: Table of Contents by Barbara Wade
2009 PhD Thesis. (672 [4]).
-
How to spot spin and
inappropriate use of statistics by Paul Bolton. 2009 UK House of Commons
Library. (656 [6]) -
Learning Statistics through Playing Cards by Thomas R. Knapp, 2012. (571
[5]).
-
The Cult of Statistical
Significance by Stephen Ziliak and Deirdre McCloskey
2009 ASA 6up
4up (520 [5]; 890[8]; 3160; 3972; 999) -
Ambiguity
Intolerance: An Impediment to Inferential Reasoning?
Robert Carver 2006 ASA (1,370 [11]; 1220; 624[5]; 797) -
Pop-Stats Books and Statistical
Education by Kaiser Fung, ASA 2011. 1up (501[3]).
-
Assessing Validity and Reliability of Likert and Visual Analog(-ue)
Scales by Thomas R. Knapp, 2013. ** New this year. {499 [4]).
-
It May Be a Great Day for Baseball,
but Is It a Great Day for a Knuckleball? Robert H. Carver
2011 ASA (444[3]; 472[3]) 6up -
Three Paradoxes.
Howard Wainer and Lisa Brown, Nat. Board of Med. Examiners. Draft
American Statistician 2004 (336 [3]; 716[6]; 913[9]; 1084[10]; 315; 750)
-
32 Principles of Data
Interpretation by Gerald Bracey 2006.
Grouped, (322
[1]).
-
Accuracy and Apparent
Accuracy in Medical Testing by Boersma and Willard, MAA 2009.
6up only. (320 [2])
Excludes papers having fewer than 300 downloads. Excludes non-articles
such as Amazon lists, reference documents (QR and statistical textbooks)
and non-statistical articles (Freeminds). It excludes pdfs that
are required for courses (Excel step-by-step instructions). Unlike
previous years, it includes PowerPoint slides and selected reference
documents (UTSA-QEP-quantitativeScholarship-Final.pdf) and pdf-scans
(1993 Weinberg).
|
|
TOP
PAGES VIEWED@STATLIT.ORG in 2013 |
Top Pages Viewed at
www.StatLit.org in 2013
(####; ####; ###; ###): page views 2013; 2012; 2011, 2010; 2009; 2008.
Note the 61% increase in page views for Index over 2012
-
Index (47,674; 29,554; 28,157, 23,159; 15,729; 10,423): Home-
Standardizing (9809; 6633; 5176; 3265; 2434; 1718) Excel
displays
-
Joel Best
(3451; 4617; 5036; 4794; 3481; 3118): Author
-
Howard Wainer (3396;
4296; 3893; 2778; 2127; 1966):
Author -
StatLit Papers
(2914; 3073; 4203; 3131; 2837; 2444) -
StatLit
News 2012
(2891; 1297[7]) -
StatLit News 2010
(2836; 2693; 2963) -
Adult Numeracy (2784; 4070; 4998, 5007; 2467; 1987)
-
StatLit News 2011
(2562; 3023)
-
StatLit News 2008 (2501; 2698; 2975;
3333; 2634)
-
StatLit News 2009
(2269; 2797; 3228; 4869)
-
Q/L Textbooks
QL3
(1868 [10]; 2233; 3159; 2741; 2484; 2387)
-
Gerd
Gigerenzer (1713*; 2283; 2567; 1993*; 1415; 1503)
Author -
Q/L Activities
QL2
(1605*; 1886; 2106; 1725*; 1278; 1378)
-
StatLit News 2007 (1527*; 1940; 2127;
2552; 1498; 1928) -
Q/L Books QLit
(1522*; 1884; 2305; 1418; 1459) No textbooks -
Gerald
Bracey (1487; 1923; 2374; 2655; 2669; 2,035): Author-
Schield (1410*
[9]) Author and webmaster of StatLit.org -
Blastland (1331* [9]) Author of "The
Tiger that Isn't" -
StatLit
News 2004
(808 [6]; 1268[9]; 1738; 1929; 1191; 1183)
Total 2013 page views (including /GC):
153,099 -- a 19% increase. |
Page views as a percentage of Total:
Index (31%),
Standardizing (6%),
Joel Best (2%),
Howard Wainer (2%),
StatLit Papers (1.9%) and Adult numeracy
(1.8%). All the rest were less
that 1.9% except "Other" (29%).
Six new pages in 2013:
Uri Bram, Conrad Carlburg,
Kaiser Fung, David Moore, StatLit2013 and
Video1.
Note: Website statistics are tabulated by
the DeepMatrix program LiveStats® .XSP V8.03. Each month, the views
for the top 25 website pages are tabulated. Those pages that
aren't in the top 25 that month are treated as having zero views.
* Pages with less than 12 months
statistics are indicated by the asterisk (no adjustment). Pages with
less than 6 months of statistics are omitted (except those that are
student assigned during certain months).
In 2013, the StatLit web site has 69 htm pages in the main directory. Others include student-assigned pages (/GC) and the
Keck Survey.
Navigation page views (2013; 2012; 2011; 2010;
2009; 2008) totaled (13,327; 10,203; 11,180; 9,716; 9,522; 8,474): Statistical
Literacy (2,482; 2,616; 3,046; 2,729; 2,396; 2,100),
Statistical
Reasoning (3,829; 2,081; 2,051; 1,617*; 1,625; 1,425),
StatLit News
(2,087; 1,980*; 2,162; 1,836;
1,928; 1,863), Authors (1,715*; 1,578*;
2,245; 1,980; 2,033; 1,860), Numeracy (1,937*; 1,533*; 1,676*; 1,554*; 1,540; 1,226)
and 2Authors2 (1277*; 415*[3]).
Student-assigned page-views
[*.xls and /GC] were not totaled.
|
|