|
STATLIT NEWS FOR
2014
Milo Schield, Editor |
Website Highlights: 12th Year
2014
-
StatLit.org still growing:
2014: Downloads up 36%; Visits
up 26%; Page views up 10%; Index views unchanged.
Over 360,000 downloads, 260,000 visits, 170,000 page views (50,000 home views).
-
1 new page: Judea
Pearl
-
Google ranked StatLit.org #8 for
"statistical literacy" (Wikipedia is #1) . StatLit is the
#1 website dedicated exclusively to statistical literacy.
-
ITD records: StatLit.org has had more
than a 1.7 million downloads, 1.4 million visits and 930,000 page views
since 2005.
|
|
|
TOP DOWNLOADS during 2014 FROM
STATLIT.ORG |
Top 10 Downloaded
Articles from StatLit.org in 2014
-
Percentage
Graphs in USA Today. Milo Schield 2006 ASA Proceedings. (7860; 7771;
17819;
19114;
11179; 13253; 14247; 8809)
Total: 100,052
-
Statistical Literacy: Uses & Abuses of Numbers by Andrew Nelson
6up
(7043; 4912) Total: 11,955 -
Two Big
Ideas for Teaching Big Data. Milo
Schield 2014 ECOTS 4602** New in May 2014.
-
Framework for Interpreting
Tables & Graphs Kemp & Kissane 2010 (3769;
2805). -
Statistical
literacy in adult college students: Table of Contents by Barbara Wade
2009 PhD Thesis. (3172*; 672 [4]).
-
Univ. Texas San Antonio: Quantitative Scholarship - Final Draft
Press release 2009 (2891[5]; 1896 [4]).
-
Statistical
Literacy: A New Mission for Data Producers by Schield. 2011
SJIAOS (2696*; 3104[8]; 2815[10]; 1723). Total: 10,338
-
Interpreting the Cumulative
Frequency Distribution of Socio-Economic Data. Othmar Winkler
2009 ASA (2625; 1515 [11]; 822[7])
-
Reality Checks for a Distributional
Assumption: The Case of “Benford’s Law” by William Goodman. (2613
[10])
-
Assessing Validity and Reliability of Likert and Visual Analog(-ue)
Scales by Thomas R. Knapp, 2013. (2596 [11]; 499 [4]).
|
Top 20 Downloaded Articles from
StatLit.org in 2014
-
Presenting Confounding Graphically Using Standardization
by Milo Schield. 2006 STATS magazine. (2578[9]; 3709 [11];
4646;
1289; 2084; 1985; 1616). Total:
17,907.
-
Statistics for Political Science
Majors. Gary Klass 2004 ASA (2423[11]; 1817; 1416[10]; 1389[10]; 596[6]; 765; 215)
Total: 8,621. -
To pool
or not to pool Knapp 2013. (2173[7]) -
Statistical Literacy Guide by Bolton (UK) 2009. (1503[9]) -
Teaching
Statistical Literacy by Haack 1978 in Teaching Statistics.
(1466 [2]) -
Statistical
Literacy Curriculum Design by Milo
Schield, 2004 IASE Roundtable, Sweden. (1289[7], 760, 457). -
The Undetectable Difference: An
Experimental Look at the “Problem” of p-Values by Bill Goodman
2010. (1138[2]).
-
Developing a Test of Normality in the
Classroom by Robert Jernigan 2012. JSM ASA (1055[2]).
-
Interpreting the substantive significance of multivariate
regression coefficients. Jane Miller 2008 ASA
(1054[5]; 1630 [9]; 3118; 1625[11]; 2094; 1412). Total:
10,933. -
Assessing
Students’ Attitudes: The Good, the Bad, and the Ugly by
Anne Millar and
Candace Schau 2010 ASA. (991[4]; 1024 [6])
Total downloads: 368,000 in 2014; 265,000 in 2013; 246,000
in 2012; 198,000
in 2011; 207,000 in 2010; 184,000 in 2009; 106,000 in 2008.
As of Dec. 2014, the StatLit
website hosted 1,114 pdfs: 787
papers and 327 slides.
|
|
NUMERACY
(NNN) JOURNAL in 2014 |
 Numeracy:
E-Journal Numeracy:
E-Journal
Numeracy is an open-access, peer-reviewed
journal launched in 2008. Numeracy aims to support
education at all levels that integrates quantitative skills across
disciplines. The journal seeks evidence-based articles. See Vacher's
NECQL and
PKAL presentations. |
  Numeracy
Editors Numeracy
Editors
Len Vacher (left) and Dorothy Wallace (right)
are editors of Numeracy: Advancing Education in Quantitative
Literacy published by the National
Numeracy Network, supported by U. of S. Florida Libraries and hosted
by
the Berkeley Electronic Press™. |
2014: Volume
7,
Issue 1
Articles:
Perspectives:
Book
Reviews:
|
2014 Volume 7,
Issue 2
Articles:
Book
Review:
|
GRANTS FOR QR, QL, SR, ST and SL in 2014 |
 Pearl:
Causality in StatEd Prize Pearl:
Causality in StatEd Prize
Judea Pearl, winner of the
ACM 2011 Turing award, funded the
ASA Causality in Statistics
Education Prize for three years. Criteria: "does the
most to enhance the teaching and learning of causal inference in
statistics." (1)
equips students with skills needed for effective causal reasoning, and
(2)
assists statistics instructors in gaining an understanding of the basics
of causal inference ..." |
 Peterson+Balzer:
Causality Prize Peterson+Balzer:
Causality Prize
The ASA awarded the
second Causality in Statistical Education prize to
Maya Petersen
(right) and Laura B. Balzer for developing the path-blazing course
“Introduction to Causal Inference” at the
University of California
at Berkeley:
PH252D. This is a graduate course in their Master's degree program. Course design and
materials are available. There were four nominations. |
 NSF
Awards: 2007-2012 NSF
Awards: 2007-2012
NSF awards mentioning these phrases by start-year
(2012,
11, 10, 9, 8, 7): numeracy (3,1,2,3,6,1), quantitative
reasoning (7,4,5,3,4,4), quantitative literacy (6,1,3,5,6,2), statistical
thinking (2,3,4,2,0,1), statistical
reasoning (1,1,2,0,0,0) and stat literacy (1,0,0,0,0,0). NSF
database:
QR (108),
QL (55),
numeracy (36),
ST (33),
SR (29),
SL (13)?? |
APPROACH:
Use "Advanced Search" Search on
probabilistic (2,851), literacy (2,427), causal (1,580), confound (339),
"observational studies" (311), "observational study" (198),
"quantitative reasoning" (115), "statistical significance" (84),
"probabilistic reasoning" (71), "statistics education" (69),
"quantitative literacy" (56), numeracy (40), "statistical thinking"
(39), "statistical education (38), "statistical reasoning" (32),
"statistical literacy" (13), "probabilistic thinking" (3), Over
3,000: statistical, education, learning, course, class, |
NEW BOOKS in 2014: PROFESSIONAL |
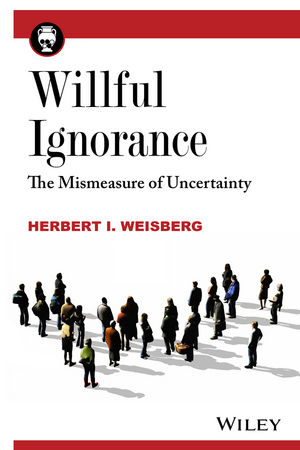 Willful Ignorance Willful Ignorance
Willful Ignorance: The Mismeasure of Uncertainty by Herb Weisberg
exposes the fallacy of regarding probability as the full measure of our
uncertainty. The book explains how statistical methodology, though
enormously productive and influential over the past century, is
approaching a crisis. The author outlines a path toward the
re-engineering of data analysis.... |
 How
Martians Discovered Algebra How
Martians Discovered Algebra
This exploration of induction and
philosophy of mathematics looks “under the hood” at the process of
mathematical theorizing, a detailed view of how the process of induction
actually works. It provides an alternative to ... modern logic,
mathematics, and set theory ..., [Read this Ebook! It
opens new pathways between math and philosophy! Ed.] |
 Statistical
Thinking & Healthcare Statistical
Thinking & Healthcare
Medical Illuminations: Using Evidence, Visualization and Statistical
Thinking to Improve Healthcare by Howard Wainer. "Medical
Illuminations presents 13 contemporary medical topics (cf. mammograms,
hip replacements, cancer maps). In each case it illustrates how modern
tools of statistical thinking and statistical graphics can illuminate
our understanding." $28 192 p [Jan 4, 2014] |
 Mastering
'Metrics Mastering
'Metrics
Mastering 'Metrics: The Path from Cause to Effect by Joshua Angrist
and Jörn-Steffen Pischke. Presents the "five most valuable
econometric methods, or what the authors call the Furious Five--random
assignment, regression, instrumental variables, regression discontinuity
designs, and differences in differences."
$28 304 p [Dec 21, 2014] |
 Presenting
Data Presenting
Data
Presenting Data: How to Communicate your Message Effectively by
Swires-Hennessey. "He advocates following four key C words in all
messages: Clear, Concise, Correct and Consistent. Following the
principles in the book will lead to clearer, simpler and easier to
understand messages which can then be assimilated faster. Anyone ...
will benefit from reading this book. More importantly, it will also
benefit the recipients of the presented data." |
|
|
NEW BOOKS in 2014: ANALYTICS |
|
 Predictive
Business Analytics Predictive
Business Analytics
Predictive Business Analytics: Forward
Looking Capabilities to Improve Business Performance (Hc $35, 2014) by
Lawrence Maisel and Gary Cokins. Maisel and Cokins shatter the
myths about this new paradigm, revealing how you can integrate
predictive business analytics with other important business management &
improvement methods, such as budgeting, forecasting & performance
reporting. |
 Data
Analysis; Business Modelin Data
Analysis; Business Modelin
Microsoft Excel 2013 Data Analysis and
Business Modeling Paperback (pb $35, 2014) by Wayne Winston.
this hands-on, scenario-focused guide shows you how to use the latest
Excel tools to integrate data from multiple tables—and how to
effectively build a relational data source inside an Excel workbook.
|
|
 Predictive
Analytics 4 Dummies Predictive
Analytics 4 Dummies
Predictive Analytics for Dummies by Bari and Chaouchi ($23, 2014).
Covers predictive analytics basics, using structured and unstructured
data, data mining, and algorithms and techniques for analyzing data.
Covers clustering, association, and statistical models; creating a
predictive analytics roadmap; and applying predictions to the web,
marketing, finance, etc, |
 S/S Models
& Decision Analysis S/S Models
& Decision Analysis
Spreadsheet Modeling and Decision Analysis: A Practical Introduction
to Business Analytics (hc, $135, 2014) by Cliff Ragsdale.
|
|
 Google
Analytics Demystified Google
Analytics Demystified
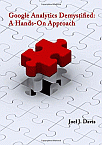
Google Analytics Demystified: A Hands-On Approach (pb, $36, 2014)
by Joel Davis. The book's approach is unique. Beyond
detailed explanations of key concepts, the book provides you with a free
website. You will be an active participant. You not only read what
Google Analytics can do, but you can apply and explore key concepts on a
working website without risk to existing data. |
 Big
Data at Work Big
Data at Work
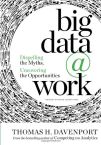
Big Data at Work: Dispelling the Myths, Uncovering the
Opportunities (hc, $22, 2014) by Thomas H. Davenport. Explains
what big data means—and why everyone in business needs to know about it.
Covers all the bases: what big data means from a technical, consumer,
and management perspective; what its opportunities and costs are; where
it can have real business impact... |
|
INFOGRAPHICS and ANALYTICS: 2014 |
 Visualization
Analysis & Design Visualization
Analysis & Design
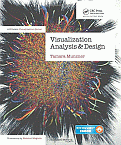
Visualization Analysis and Design (pb, $75, 2014) by Tamara
Munzner. The book breaks down visualization design according to
three questions: what data users need to see, why users need to carry
out their tasks, and how the visual representations proposed can be
constructed and manipulated. It walks readers through the use of space
and color to visually encode data ... |
 Essentials
of Business Analytics Essentials
of Business Analytics
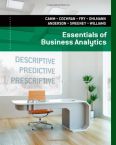
Essentials of Business Analytics (hc, $195, 2014) by Camm &
Cochran. Covers "the full range of analytics-descriptive, predictive,
prescriptive--not covered by any other book. Includes step-by-step
instructions to help students ... use Excel and powerful but easy to use
Excel add-ons such as XL Miner for data mining & Analytic Solver
Platform for optimization & simulation. |
|
StatLit website: New Papers Hosted in 2014 |
|
2014 ARTICLES POSTED TO
STATLIT.ORG
12
Majority statistical analysis not performed by statisticians
2013 Simply Stats
12
Simpson's Paradox Psychological Science by Kievit et al. Aug
2013
12
Statistical Literacy Explained Paul Hewson Teaching Statistics,
Feb 1. 2013
12
Headlines
in Math-Literate World Ben Orlin Huffington Post, Dec 4, 2013
blog
12
RSS GetStats
Statistical Literacy Campaign and Initiatives. 2014
12
2013
ASA News: Causality in Statistics Education Award 2013 ASA JSM.
12
2013
AMSTAT: Causality in Statistics Education Award 2013 ASA JSM.
12
Big Data & Big Business:
Should Statisticians Join? Walker & Fung 2013 Signif.
12
SIGMAA-QL 2013 Newsletter.
Bennet: Writing math book for general public.
12 Bayes: Why Bother by
Thomas Louis, Johns Hopkins Bloomberg SPH.
Slides
12 Single World Intervention Graphs
(SWIGS) Robbins & Richardson. 2013.
Slides
|
11
Causal Impact: Estimating Causal Effects in Time Series. Google 11/2014
11
SERJ: Call for papers
on Statistical Literacy. 2014
08
Simpson's Paradox (#30) in Classic Problems in Probability
by P. Gorroochurn
08 Top 30 Learning Goals for
Introductory Sociology. Caroline Persell
1-Page List
08 Social Science & QL Learning
Goals by Caulfield & Persell 2006
One-Page List
07
Odyssey: A Journey to Lifelong
Statistical Literacy Schield ICOTS 2014
Slides
05
Two Big Ideas for Teaching Big Data Schield 2014 ECOTS.
Slides
Panel slides
04
Teaching Big Data by
Sigman, DSI Magazine
01
Dynamic Visualization of Economic
Indicators Thompson & Wallace. ASA 2013.
01
Fusion and causal analysis in big marketing data sets Igor Mandel
ASA 2013
01 Reality
Checks for Distributional Assumption: Benford Law Goodman ASA 2013
01
Challenging Statistical Claims in the Media, Martinez-Dawson ASA 2013
|
|
Making
Statistics More Effective in Schools of Business 2014 |
 Decision
Sciences Meeting Decision
Sciences Meeting
Making Statistics More Effective in
Schools of Business (MSMESB) fielded over a dozen sessions at the 2014
annual meeting of the Decision Sciences Institute (DSI).
Robert Andrews
(Virginia Commonwealth University) was the key organizer, the chair of
several sessions and the MSMESB webmaster.
2013 MSMESB DSI SIG Report.
Local copy
Keith Ord: What is AP Statistics?
Slides |
 Business
Analytics: Business
Analytics:
John McKenzie (right): Introducing Big Data in Stat101 with small
changes.
Slides
Kirk Karwan: Creating Analytics Class at Furman.
Slides
Kirk Karwan: Analytics Curriculum.
Slides
Satish Nargundkar: Georgia State Analytics.
Slides
James R Evans: Spreadsheet Analytics.
Slides
Robert Stine: Big Data Implications for intro stats.
Slides |
|
 Levine,
Szabat and Stephan Levine,
Szabat and Stephan
David M. Levine
(Baruch College: CUNY),
Kathryn Szabat
(LaSalle University) & David Stephan
(Two Bridges Instructional Technology) presented A Course in Data
Discovery & Predictive Analytics.
Slides.
Presents general principles of using big data and data discovery;
includes a detailed week by week list of topics and recommended software
for the course. |
 Mark
Berenson Mark
Berenson
Statistics Course for Big Data & Analytics.
slides
Big Data Implications for Stat Analysis & Instruction
slides
"The time has come for AACSB-accredited
undergraduate programs to include a core-required course in Business
Analytics as a sequel to a course in Business Statistics." |
|
Introductory Statistics
Webster West: What Should We Teach in an
Intro Stat Course?
slides
Amy Phelps: Write What? I thought this was a Math class.
Slides
Mark Eakin: Simplifying Framework
for an Intro Stats Class.
Slides |
Other Topics
Norean Sharpe: Does AP Exam Credit Have an Impact on GPA?
slides
Aric LaBarr: Analytics Education and the
Evolving Workforce
Slides
M Gisela Bardossy: Mini-Cases using Baltimore ... Indicators
slides |
|
Statistical Publications &
Journals:
2014 |
 Significance
Magazine Significance
Magazine
Jan:
The Timeline of Statistics by Julian Champkin.
Feb:
The Palma measure of income
inequality - Alex Cobham, Andy Sumner
Feb:
Even birds follow Pareto's 80–20 rule - Rispoli, Zeng,
Green & Higbie
Feb Visual:
The champagne glass effect. J. Champkin
Feb:
North Americans – one third of world's weight?: Obesity and the
comma - Stella Dudzic |
 Teaching
Statistics: Teaching
Statistics:
Summer:
Regression Analysis and the Sociological Imagination by Fernando De
Maio.
Summer:
Monty's dilemma with no formulas. Ruma Falk
Fall:
Developing Consistency in the Terminology and Display of Bar Graphs and
Histograms by Patricia B. Humphrey, Sharon Taylor and Kathleen Cage
Mittag. |
|
 Significance
Magazine (continued) Significance
Magazine (continued)
Oct:
Does New York City really have as many rats as people? by Jonathan
Auerbach
Oct:
A world without statistics by Andrew Gelman.
Dec:
Cutting through the numbers Statisticians need to prioritise clear
communication over numerical detail, says Ed Swires-Hennessy as he
discusses his new book, Presenting Data, with Allan Reese.
|
 CHANCE
Magazine:
Howard Wainer CHANCE
Magazine:
Howard Wainer
11/20:
Visual Revelations:
Happiness & Causal Inference
9/24:
Musing About Changes in the SAT: Is the College Board Getting Rid of the
Bulldog?
4/16:
Life Follows Art: Gaming the Missing Data Algorithm
2/13:
On the Crucial Role of Empathy in the Design of Communications: Genetic
Testing as an Example |
|
 SERJ: SERJ:
Building Capacity for Developing Statistical Literacy in a Developing
Country: Lessons Learned from an Intervention by Delia North (right), Iddo
Gal, and T. Zewotir.
When
Statistical Literacy Really Matters: Understanding Published Information
about the HIV/AIDS Epidemic in South Africa by Sally Hobden.
Call for Papers: Research on Statistical
Literacy |
 SERJ: SERJ:
Exploiting Lexical Ambiguity to Help Students Understand ... Random
by Kaplan (right), Rogness & Fisher.
Use of
Data Visualisation in the Teaching of Statistics by Forbes, Chapman,
Harraway, Stirling, and Wild.
Middle
School Students’ Statistical Literacy: Role of Grade Level and Gender
by Ayşe Yolcu |
|
OTHER JOURNAL ARTICLES in 2014 |
|
Statistical Literacy and Data Literacy
Data Interpretation in the 21st Century: Issues in the Classroom by
James
Nicholson and Gerry Mulhem. 10/2014. |
Simpson's Paradox
|
|
ICOTS in 2014 |
 ICOTS-9
in Flagstaff, AZ ICOTS-9
in Flagstaff, AZ
Great keynote!
What can we learn from real-world communication of risk and uncertainty?
by David Spiegelhalter (and Jenny Gage).
Statistical Literacy was a dominant topic
at ICOTS-9.
Proceedings.
Topic 7,
Statistical literacy in the wider society, was organized by Bob del
Maas (US), Sebastian Kuntze (Germany) and Michiko Watanabe (Japan). |
7A: Statistical literacy beyond the Classroom
Organized by Carl Lee.
7A1:
Odyssey: A Journey to Lifelong
Statistical Literacy by Milo Schield
Slides.
7A2:
Teaching statistics for engagement beyond classroom walls by Larry
Lesser.
7A3:
Taking statistical literacy to the masses with YouTube, blogging,
Facebook and Twitter by Nicola Petty Ward |
7B: Statistical literacy requirements for teachers
7B1:
Statistical literacy requirements for teachers: Jeffrey Hovermill,
Brian Beaudrie, Barbara Boschmans
7B2:
Developing statistical knowledge for teaching of variability through
professional development: Helena Wessels
7B3:
Teachers’ views related to goals of the statistics classroom – from
global to content-specific: Sebastian Kuntze |
7C: Assessing Statistical literacy 7C1:
Towards statistical literacy - relating assessment to the real world:
Penelope Bidgood
7C2:
Establishing the validity of the LOCUS assessments through an
evidenced-centered design approach: Tim Jacobbe, Catherine Case,
Douglas Whitaker, Steve Foti
7C3:
Sufficiently assessing teachers’ statistical literacy: Helen Chick,
Robyn Pierce, Roger Wander |
7D: Developing Statistical literacy
7D1:
Students’ beliefs about the benefit of statistical knowledge when
perceiving information through daily media: Alexandra Sturm, Andreas
Eichler
7D2:
Changing the course: from boring numeracy to inspiring literacy:
Kimmo Vehkalahti
7D3:
A numeracy infusion course for higher education (NICHE): strategies for
effective QR instruction: Esther Isabelle Wilder, Elin Waring, Frank
Wang, Dene Hurley
7D4:
Implementing a quantitative literacy core competency requirement in the
College of Arts and Science at Miami University: John Bailer |
7E: Factors that Affect Statistical Literacy 7E1:
Critical thinking as an impact factor on statistical literacy –
theoretical frameworks and results from an interview study: Einav
Aizikovitsh-Udi, Sebastian Kuntze
7E2:
A multilevel perspective on factors influencing students’ statistical
literacy: Ute Sproesser, Sebastian Kuntze, Joachim Engel
7E3:
Sustaining communication of the value of statistics in the humanities:
Nicole Mee-Hyaang Jinn |
7F: Factors that Affect Statistical Literacy
7F1:
Reconceptualizing statistical literacy: Developing an assessment for the
modern introductory statistics course: Laura Ziegler
7F2:
Improving statistical literacy through supplemental instruction:
Alexandra Kapatou
7F3:
Interpreting variation of data in risk-context by middle school students:
Antonio Orta, Ernesto Sánchez |
9C: Big Data and Data Science for Education 9C1:
Exploring “white flight” via open data and big data: James Ridgway,
James Nicholson, Sean McCusker
9C2:
Teaching data science to teenagers: Amelia McNamara, Mark Hansen
9C3:
Integrating big data into the science curriculum: Daniel Kaplan,
Paul Overvoorde, Elizabeth Shoop |
|
ECOTS
in 2014 |
 Breakout
Sessions Breakout
Sessions
Statistics for the
21st Century: Are we Teaching the Right Course? Richard De Veaux and
Daniel J. Kaplan (left)
Two Big Ideas for
"Big Data" Analytics. Schield
paper.
How Introductory ,,
Statistics .. Instructors Can Introduce Big Data through Four of its Vs
John McKenzie
Panel: Teaching from Big data. Schield
slides. |
Poster: Ensuring
Statistical Literacy for Pre-Service Education Majors Stacy M.
Bjorkman & Kelly H. Summers
Poster: Use of
Gapminder.org in Introductory Statistics to Bridge Across Disciplines
Dai-Trang Le, UCLA
Poster: Integrating
Writing in the Statistics Curriculum Dean Poeth & Jane Oppenlander,
Union Graduate College.
Poster: Stay Calm
and Think Critically: Student Perceptions of Numbers in Introductory
Statistics. Marc Isaacson, Augsburg College |
|
ASA JSM in 2014 |
 JSM
JSM
Five papers in the Proceedings included "confound" in their title or abstract. Eight papers included
"statistical literacy" (one of these is
Schield). 52 included "caus" (e.g., cause, causal,
etc.) |
JSM
Published Papers In Process |
|
2014 GENERAL INTEREST NEWS |
-
2014:
The
Importance of Statistics by RSS GetStats Board Members. RSS
Get Stats: Influencing Change -- Statistical Literacy.
-
2014 Dec 23:
Bob Hogg: A
Statistical Giant. RIP.
-
2014 Nov 13:
Meet Common Core Standards with Statistics.
Posted by Jeff Wyman on November 13th, 2014.
Copy -
2014 May 21:
Two Big Ideas for Teaching Big
Data: Coincidence and Confounding
by Milo Schield. ECOTS invited paper.
This paper was downloaded over 850 times in the first 10 days after being
posted (over 4,000 times in May-Nov 2014). See also Schield
slides presented at Big
Data panel.
-
2015 April. DSJIE (Decision Science Journal of
Innovative Education) is soliciting submissions for two special issues.
Rethinking Undergraduate Business Education: In the Classroom and
Beyond (Call:
submission deadline June 1, 2014). Educational Innovation and
Reform in the Decision Sciences Using Multidisciplinary and
Collaborative Practices (Call:
submission deadline August 1, 2014).
-
2014 April.
Willful Ignorance: The Mismeasure of Uncertainty
by Herbert Weisberg. Available
from Amazon.-
2014 Feb 28.
Improving [NZ] journalists’ statistical literacy via a new unit standard -
2014 Feb 16.
Misconceptions of science and religion
found in new study
• Nearly 60 percent of evangelical Protestants and 38 percent of all
surveyed believe “scientists should be open to considering miracles in
their theories or explanations.” • 27 percent of Americans feel that
science and religion are in conflict. • Of those who feel science and
religion are in conflict, 52 percent sided with religion. • 48 percent
of evangelicals believe that science and religion can work in
collaboration. • 22 percent of scientists think most religious people
are hostile to science. •Nearly 20 percent of the general population
think religious people are hostile to science. • Nearly 22 percent of
the general population think scientists are hostile to religion. •
Nearly 36 percent of scientists have no doubt about God’s existence. -
 2014 Jan.
Teaching Big Data:
Experiences, Lessons Learned, and Future Directions by by Betsy Page
Sigman, William Garr, Robert Pongsajapan, Marie Selvanadin, Kristin
Bolling, Greg Marsh, Georgetown University. DSI p 9-15. 2014 Jan.
Teaching Big Data:
Experiences, Lessons Learned, and Future Directions by by Betsy Page
Sigman, William Garr, Robert Pongsajapan, Marie Selvanadin, Kristin
Bolling, Greg Marsh, Georgetown University. DSI p 9-15.
-
2014: Jan 31.
Texas drops Algebra II requirement; offers statistics and algebraic
reasoning as alternatives.
The Texas Board of Education adopted two new math courses on Thursday that
are designed to cover much of the same material offered in algebra II,
which will no longer be required for high school students under the
Legislature's academic curriculum overhaul.
The board voted ... to create two high-level math courses that could be
alternatives: statistics and algebraic reasoning. Both will be developed
by local schools under the guidance of the Texas Education Agency, and
are designed to cover many of the same concepts covered in algebra II.-
2014:
Jan 27 issue, Woman's World magazine cover:
"Breakthrough new study: This lifesaving diet lowers yours obesity
risk 300%." Page 19: "A new study found folks who eat
vegan are 300% less likely to ever become obese. That's triple
protection against obesity for life!"
|
|
Conferences in 2014 |
-
2014 Dec 5.
TAS Special Issue: "Statistics and the Undergraduate
Curriculum".
Submitted papers should focus on aspects of statistical
education beyond the first course for undergraduate
(post-secondary) students... Manuscripts should be submitted via the
TAS website using the on-line portal system (see http://mc.manuscriptcentral.com/amstat).
Authors should indicate in their cover letter that the paper
is being submitted for the Special Issue on Undergraduate
Programs (select the "Statistics and the Undergraduate
Curriculum" manuscript type). All submissions are due by
December 5th, 2014. Submitted papers will follow standard
TAS external review procedures. The Special Issue will be
published in November 2015. Inquiries and questions can be
directed to any of the issue co-editors (nhorton@amherst.edu
or Jo.Hardin@pomona.edu).
2014: Nov 22-25.
DSI Annual Meeting Tampa, FL.
Submission Deadlines.
May
1, 2014 - Full Paper Submissions and All Competition Entry
Submissions. May 15, 2014 - Abstract Submissions, Panel,
and Workshop Proposals.
2014
Oct 30-31.
NCTM Regional Conference Indianapolis, IN.
DATA &
STATISTICS.
Thursday, October 30, 2014
8:00-9:00. How We are Lied to, Cheated and Manipulated by
Statistics by Ed D Zaccaro Grades: 6 to 8, 9 to 12
8:00-9:15. The Common Core Statistics-Plus/minus 4% by Gail
Burrill. Grades 9 to 12.
9:30-10:30 Ruling Out Chance by Roxy Peck. Grades 9 to 12
2:00-3:00. Standard(s) Statistics: Engaging with CCSS
Mathematical Practices and Statistical Content by Susan A.
Peters Grades 6 to 8
3:30-4:30. Statistics of Illumination by Allan J. Rossman.
Grades 9 to 12.
Friday, October 31, 2014
12:30-1:30. k-12 Statistics Education from NCTM 1989 to
Common Core 2013 by Jerry L. Moreno. General Interest/All
Audiences
1:30-2:45. Big Ideas in Grade 6-8 Statistics in the Common
Core by J. Michael Shaughnessy. Grades 6 to 8
2:00-3:00. LOCUS, A Tool For Assessing Statistical Reasoning
in the CCSS by Douglas Whitaker and Tim Jacobbe. Grades 6 to
8, 9 to 12
2014 Oct 10-11 NNN
Annual Conference at Carleton College.
Program
2014:
Aug 2-7.
ASA-JSM
2014 Boston, MA.
Data Analytics in Business and Education. Topic-contributed
panel. Sponsor: Section on Statistical Education. Session
210126; Abstract 311733. Organizer: Milo Schield. Chair:
Robert Carver. Abstract: Data analytics is a rapidly changing field
and a driving force in business, in schools of business and in
statistics education. Panelists will provide background on their
connection with data analytics in business and address three
questions: (1) What statistical problems are you dealing with in
analyzing data? (2) What statistical tools or techniques are you
using or planning to use? (3) What underlying statistical ideas
should statistical educators be teaching budding data analysts to
help them better analyze "big data"?
Monday 7:00 - 8:15 Roundtable:
Teaching Introductory
Statistics from a Bayesian Perspective by Jim Albert,
Bowling Green State University. There are challenges
in teaching frequentist inference in the introductory
statistics class and advantages to using a Bayesian
viewpoint. Given the current popularity in the application
of Bayesian methods, is it time to revisit the Bayes
introduction statistics class?
Monday 8:55 High-Dimensional Confounder Reduction for the
Estimation of a Causal Quantity Mireille Schnitzer
Monday 10:35 Causal Inference in the Presence of
Interference and Unmeasured Confounders Cheng Zheng,
University of Washington
Monday 10:50 Toward a General Theory of Observational Causal
Inference Sterling Portwood, Center for Interdisciplinary
Science
Monday 10:30: Quantitative Literacy and Introductory
Statistics session.
10:35 AM Connecting the Dots: Ways to Enhance a Noncalculus-Based
Introductory Statistics Course — Adrienne Chu
10:50 AM Introducing Hypothesis Testing with a Reflection
Exercise and Student-Selected Synonyms — Frank Matejcikand
Ahmed Al-Asfour
11:05 AM Information Bias in Surveys — William Rybolt,
Babson College ; George Recck, Babson College
11:20 AM Teaching Statistics Using Political Polls — T.
Ceesay, Merck
11:35 AM Statistics in Journalism: Guiding Students to
Uncrunch the Numbers — Nancy Pfenning, University of
Pittsburgh
11:50 AM Against All Odds: Inside Statistics — Marsha Davis,
Eastern Connecticut State University
12:05 PM Quantitative Literacy: Analysis of a Q-Course —
Massaro, Orta, Boppana, Sass, Straud and Sanchez, Univ. of
Texas at San Antonio
Monday 2:05 PM The ASA Statistical Education Section: An
Updated History with Emphasis on Its Last 25 Years —
Halvorsen and McKenzie Jr.
Monday 2:50 PM Introductory Statistics in Two-Year Colleges:
Important to Our Future — Brian Kotz, Montgomery College
Monday 3:20 PM Redesigning Business Statistics ... in Light
of Common Core State Standards — Bodapati Gandhi and
Srinivas P. Gandhi.
-----
Tuesday 7:00 Roundtable: Causal Inference in Statistics and
Epidemiology James Robins, Harvard School of Public Health
Tuesday 11:20 AM Analyzing Real Data Demands Database Skills
— Robert Carver, Stonehill College
-----
Wed 8:30 Data Analytics in Business & Education. Victor Lo,
Fidelity Dan Coyle, ProQuest Dan Katz, RepEquity Shaju
Puthessery, DentaQuest
Wed 10:30 Posters.
30: Heuristic Biases in an Introductory Statistics
Course — Andrew Neath, SIU Edwardsville
31: At What Point Do Students' Attitudes Change? — April
Kerby, Winona State University ; Jacqueline Wroughton,
Northern Kentucky Univ.
34: Teaching Hypotheses-Testing with Binomial Test and
Pepsi-Coke Challenge — Phyllis Curtiss, John Gabrosek, Kirk
Anderson, Grand Valley
37: Discrepancies Between the Bivariate Correlation and
Effect-Size Indices — Ariel Aloe, Univ. Northern Iowa ;
Betsy Becker, Florida State
44: From Measurement Errors to Normal Distributions: A Brief
History and Its Pedagogical Implications — Ilhan M. Izmirli,
George Mason U.
46: Evolving a Traditional Business Statistics Course into a
General Education Requirement Course — Cathy Poliak, U of
Wisconsin-Milwaukee
Wed 12:30 Roundtables:
WL17: Visualization: Another V Associated with Big Data
— John D. McKenzie Jr., Babson College
WL18: Ideas for Teaching Statistics from Popular Science
Books — Allan Rossman, Cal Poly, San Luis Obispo
....... Are Observational Studies Any Good? David
Madigan, Columbia University
-----
Thurs 8:30 Building Programs in Business Analytics
Panelists: Alan Montgomery, Carnegie Mellon David Levine,
Baruch College Harry Chernoff, New York University J. Keith
Ord, Georgetown University Kellie Keeling, University of
Denver
2014:
July & Aug:
2014 Causal Inference Workshops:
Main and Advanced. Northwestern University and Duke University are holding two
workshops on Research Design for Causal Inference this year. We
invite you to attend either or both. Apologies for the length of
this message, which covers both. Main workshop: Monday -
Friday, July 7-11, 2014 [at Northwestern] Advanced
workshop: Wednesday - Friday, August 13-15, 2014 [at Duke] Both
workshops will be taught by world-class causal inference
researchers. See below for details. Registration for each is
limited to 100 participants. We filled the main workshop quickly
last year, so please register soon. For information and to
register: www.law.northwestern.edu/faculty/conferences/causalinference/
2014: July 13-18.
ICOTS-9
Flagstaff, AZ. Theme:
“Sustainability in Statistics Education” The following are
some of the 300 papers.
David Spiegelhalter (Cambridge)
What can we learn
from real-world communication of risk and uncertainty?
[A brilliant presentation!]
Topic 7:
Statistical
literacy in the wider society (Robert C delMas, Sebastian
Kuntze, Michiko Watanabe). "A perennial ICOTS theme is our
special responsibility to develop sustainable initiatives which
enable citizens to lead and extend debates, in the media and
elsewhere, on issues of inequality, crime, effects of smoking, use
of alcohol, and support for societal preferences. This democratic
imperative leads us to questions such as: How can we encourage
people to want to engage in statistical learning? How can we
contribute to subject-specific learning of relevant statistical
knowledge? How do we enrich our understanding of statistical
literacy and methods by which it can be attained and sustained?
These invited sessions seek to explore and enrich a variety of
effective practices and interventions."
Section 7A:
Statistical literacy
beyond the classroom. Carl Lee, Organizer.
7A1:
Odyssey: a journey
to lifelong statistical literacy by Milo Schield
7A2:
Teaching Statistics for
Critical Engagement Beyond Classroom Walls by Larry Lesser.
7A3:
Taking statistical literacy to the masses
with YouTube, blogging, Facebook and Twitter by
Nicola Ward Petty.
Section 7B: Statistical Literacy Requirements for
Teachers. Sebastian Kuntze and Ute Sproesser,
Organizers.
7B1
Statistical Literacy Requirements for Teachers by
Brian Beaudrie.
7B2
Improving statistical knowledge
for teaching of variability through professional development by
Helena Wessels (South Africa).
7B3
Teachers’ views
related to goals of the statistics classroom – from global to
content-specific by Sebastian Kuntze (Germany).
Section 7C: Assessment of statistical literacy.
Rosemary Callingham (Australia), Organizer.
7C1
Towards statistical
literacy - relating assessment to the real world by Penelope
Bidgood (United Kingdom).
7C2
Validity of the LOCUS Assessments
by Catherine Case (United States).
7C3
Assessing teachers’
statistical literacy by Helen Chick, Roger Wander and Robyn
Pierce (Australia).
Section 7D: Developing statistical literacy: Case studies and
lessons learned. Iddo Gal, Organizer.
7D1
Students’ beliefs about the
benefit of statistical knowledge through daily media by Alexandra Sturm and Andreas Eichler
(Germany).
7D2
Changing the course: from boring numeracy
to inspiring literacy by Kimmo Vehkalahti (Finland).
7D3
A
numeracy infusion course for higher education (NICHE):
strategies for effective QR instruction
by Wilder, Waring, Wang and
Hurley (US).
7D4
Implementing a QL core
competency requirement in the College of Arts and Science at
Miami University by John Bailer (US).
Section 7E: Factors that Affect Statistical Literacy.
Einav Aizikovitsh-Udi (Israel) and Sebastian Kuntze (Germany),
Organizers.
7E1
Critical thinking as an impact factor on statistical
literacy by Einav Aizikovitsh-Udi (Israel) and Sebastian Kuntze
(Germany).
7E2
A multilevel perspective on factors influencing
students’ statistical literacy by Ute Sproesser, Sebastian
Kuntze and Joachim Engel.
7E3.
Sustaining communication of the value of statistics in the
humanities by Nicole Mee-Hyaang Jinn (Virginia Tech Univ.)
Session 7F: Factors that
affect statistical literacy II. Session
organizer and Chair: Einav Aizikovitsh-Udi (Israel)
7F1 Laura
Ziegler
Reconceptualizing statistical literacy: Developing an assessment
for the modern introductory statistics course.
7F2
Alexandra Kapatou
Improving
statistical literacy through supplemental instruction.
7F3 Antonio Orta
Interpreting variation of data in risk-context by middle school
students
Session 8I: Research on Risk Literacy.
Laura Martignon (Germany), Organizer.
8I1:
Getting alternative representations for risk into the
school syllabus by David Spiegelhalter (UK).
8I3:
Risk
literacy: first steps in primary school by Christoph Till
(Germany).
Session 1F: The importance of attitudes in statistics
education. Marjorie Bond and Candace Schau (US),
Organizers.
1F1
Student attitudes toward statistics from a randomization-based
curriculum by Swanson, VanderStoep and Tintle.
1F2
How do attitudes change from one stats course to the next?
by Anne Millar and Bethany White.
1F3
A fallacy in student attitude research: the impact of the first
class by Michael Posner
1F4
Comparing attitudes toward statistics among students enrolled in
project-based and hybrid courses by Caroline Ramirez &
Marjorie Bond.
4F Opening up the data world wider and faster.
Jennifer
Kaplan (US), Organizer.
4F1
Introductory statistics in the 21st century by Richard De
Veaux
4F2
DataFest: celebrating data in the data deluge by Robert
Gould
4F3
Middleware for Middle Earth by Chris Wild
4F4
Open data, civil society and monitoring progress: challenges for
statistics education by Joachim Engel
Session 5D: Development of statistical thinking in the
workplace. Shirley Coleman (United Kingdom),
Organizer.
5D1
Improving statistical literacy without a statistics class by
Jennifer Brown, Seddon, Moltchanova, Harlow and David.
Session 6B: Probability and p-values — probing the problems.
Robyn Reaburn (Australia), Organizer.
6B1:
Impact of a randomization-based curriculum on student
understanding of p-values and confidence intervals by Chance
& McGaughey
6B2:
Teaching probability: using levels of dialogue and proportional
reasoning by Ian Hay
6B3:
The interpretation of effect size in published articles by
Rink Hoekstra
Session 10A: Collaborations between Statistics agencies and
academia (schools/colleges). John Harraway (NZ),
Organizer.
10A2
Developing statistical literacy amongst in-service teachers
through a collaborative project by Delia North, Temesgen
Zewotir and Iddo Gal
10A3
SMARTCensus – making sense of census data by James
Nicholson, Jim Ridgway and Sean McCusker
10A4
More ways to Heaven than one: improving
statistical literacy in Ireland by
Steve MacFeely
1C1
Outreach efforts to enhance statistical education
and statistical literacy in Hungary by Peter Kovacs
1D2
Building capacity for developing statistical
literacy in a developing country by Temesgen Zewotir
4E2
A comparison of attitudes between traditional and hands-on
classes in an introductory statistics course by Carl Lee
Selected Contributed papers:
* C101 A graphical approach to examine
inferential reasoning development by Sharon Lane-Getaz
* C122
Students understanding of confidence intervals:
implications for teaching by Robyn Reaburn (Australia)
* C134
It is time to include data management in
introductory statistics by Robert H. Carver & Mia Stevens (United States).
* C171
The professional knowledge of German secondary school teachers
about descriptive statistics by Stefanie Schumacher
(Germany)
* C196
The status of reform in statistics education: A
focus on the introductory course by Rossi Hassad (United
States).
* C203
A shiny new opportunity for big data in statistics
education by Karsten Tait Maurer (United States)
* C206
A graphical illustration of binomial distributions
by Kang Sup Lee and Dong Joo Yang (Korea)
* C212
An evaluation of the statistical methods used by
business researchers in South African publications by Gary D
Sharp (South Africa)
* C215
Sustaining student engagement in a college statistics course
using youth statistics by Liza Jala and Enriqueta Reston
(Philippines)
* C216
Teachers’ confidence in teaching statistical ideas
by Rosemary Callingham and Jane M. Watson
(Australia).
*
C226
How I learned to stop worrying and just teach MBA
5800 (with apologies to Dr. Strangelove) by Alan S Chesen
(United States)
* C238
Teaching hypothesis testing: a necessary challenge
by Wendy J. Post and Marijtje A.J. Van (The Netherlands).
* C242
Developing conceptual understanding: the role of
interactive dynamic technology by Gail Burrill (United States).
* C244
Invariance and descriptive statistics by Guido del Pino
(Chile)
* C276
A view of statistics education research in Brazilian extreme
south coast Mauren Moreira Porciúncula da Silva
* C283
Against all odds: Inside statistics by Marsha Davis
(United States)
* C287
Enhancing statistical literacy and thinking through analysis of
scientific journal articles by Mahtash Esfandiari (US)
* C290
Teaching critical thinking through the introductory statistics
class by Mark Ferris (US)
Selected Posters:
* P02 A first course in data mining: sustaining statistical
education in the modern business curriculum. Deborah Gougeon
* P10 The “lady” has a name:
teaching history of statistics using Salsburg with corrections.
Kirk Anderson and Phyllis Curtiss
* P21 Assessing students’ statistical reasoning: Dana
Kirin and Jennifer Noll
* P23 Development of
statistical literacy in undergraduate students Diana Keosayian
and
Elizabeth Johnson
* P26 Evidence-based
policy making and statistical education. Kyung Ae Park
* P31 Epidemic: a computer based training environment for
informal inferential reasoning. Joachim Engel and Tim Erickson
* P34 Using actionable intelligence to enhance student
success in introductory statistics courses. Brenda Gunderson and
Karen Nielsen
* P36
High school teachers’ conditional probability
content knowledge Adam Molnar
Tasks
* P37 Attention to details:
does it facilitate or impede learning. Bill Rybolt
* P43 Keeping the momentum:
sustaining interest in statistics lectures for non-statisticians
Angie Wade, Eirini Koutoumanou and Vicki Aldridge
* P45 Towards a more conceptual way of understanding and
implementing inferential rules. Johanna Hardin and Thalia
Rodriguez
* P48 Exploring statistical literacy in Northeast China
Robert Giebitz
* P50 On statistics
education innovation from statistics development perspectives.
Yu Zhu Meng Wang
-
2014: July 7-11.
2014 IMS Annual Meeting Sydney, Australia
-
2014
June 1.
Rethinking Undergraduate Business Education: In the Classroom and
Beyond. DSI Journal of Innovative Education. Call for
papers: June 1.
-
2014: May 19-23.
eCOTS: Electronic Conference on Teaching Statistics.
Program
Presentation
sessions should address one of the three themes: (1)
Teaching from Big Data: What are some of the issues
and challenges when it comes to using big data for teaching and
learning purposes? How can a focus on big data change the way we
teach statistics? How can we teach data analytic methods that
draw insights from massive data? (2) The Impact
of the Common Core: How can we better prepare, at the
college level, future teachers of statistics at all levels
(K-16)? How must teachers be prepared to deal with the Common
Core State Standards? Further, how should the teaching of
statistics at the college level change in light of changes in
the K-12 statistics curriculum? (3) Bridging the
Disciplines: How can we enhance the centrality of
statistics across the disciplines? What can we learn from and
take from other disciplines in order to create a more positive
learning experience for our students? How can we connect with
other disciplines and forge relationships with these disciplines
that will be mutually beneficial? How might we create valuable
learning experiences for students that will prepare them to work
in multidisciplinary teams?
1)
Keynotes:
Mon 11 Preparing K-12 Teachers to Navigate the Data
Stream: Great Opportunities and Challenges with Christine
Franklin, Univ of Georgia
Wed 11 Fundamentally Changing Maths Education for the New Era of
Data Science with Conrad Wolfram, The Wolfram Group
2) Selected
Breakout
sessions on Teaching from Big Data: (All times are
Eastern Daylight Time)
Mon 15:30 "Big Data, Data Science and Next Steps for
the Undergraduate Curriculum" with Nicholas J. Horton,
Amherst College
Tues 11:30 "How Introductory Applied Statistics Course
Instructors Can Introduce Big Data through Four of its Vs".
John McKenzie, Babson College
Tues 2:30
Two Big Ideas for Teaching Big Data:
Coincidence and Confounding
by Milo Schield.
Slides
Data
Wed 10:00 "Statistics for the 21st Century: Are we
Teaching the Right Course?" Richard Deveaux,
Williams & Daniel J. Kaplan, Macalester
Wed 14:15 "Panel on Big Data":
Nicholas Horton, Amherst; Daniel Kaplan, Macalester; Mine
Cetinkaya-Rundel, Duke; John McKenzie, Babson; Milo Schield,
Augsburg Slides.
3) Selected
Virtual Posters:
*
Ensuring
Statistical Literacy for Pre-Service Education Majors Stacy
M. Bjorkman, Walden U. & Kelly H. Summers, N. Illinois U.
*
Stay Calm
and Think Critically: Student Perceptions of Numbers in
Introductory Statistics by Marc Isaacson, Augsburg College
Slides
Abstract: Students entering an introductory statistics course
bring a number of attitudes and perceptions regarding statistics
encountered in our daily life. Some students arrive awestruck by numbers
while others tend to be completely cynical of any number no matter its
source. This poster will present the findings of 2 sets of surveys. One
regarding the perceptions of incoming introductory statistics students
and the other a group of over 100 statistical educators surveyed in 2012
regarding the perceptions of their students. While large numbers of
students admitted to being at either end of the spectrum from being
naive about numbers to completely distrustful of all statistics, over
80% of statistical educators stated that an introductory course learning
objective should include moving students towards the middle of this
spectrum with the goal of being a critical thinker regarding statistics.
Recommendations regarding revised learning objectives for the
introductory course and course revisions will be discussed.
Tues 2:30:
Two Big Ideas for Teaching Big Data:
Coincidence and Confounding by Milo Schield.
DESCRIPTION: Coincidence and confounding are two statistical
influences that dominate when dealing with “big data.” These
ideas are being taught in Augsburg’s “Statistical Literacy for
Managers” course using Excel. Participants will access
Excel worksheets demonstrating the Law of Very Large Numbers (as
data size increases, the unlikely becomes almost certain).
Participants will analyze data showing a sign-reversal after
controlling for a confounder. Participants will examine
the claim that confounding is incidental in forecasting, but is
essential in causal exploration.
Engagement: Participants will be encouraged to (1) form
generalizations on the influence of confounding and coincidence
as the number of data records increases and (2) discuss the
importance of teaching these ideas in introductory statistics. Take-away: Participants should have a better
idea of what might be taught when dealing with big data in
introductory statistics. Slides
Data -
2014
April 15. Added new page for Herbert I.
Weisberg at StatLit.org. -
2014
March.
Epidemiology as a liberal art: from graduate school to middle
school, an unfulfilled agenda by Michael B. Bracken (Yale).
Annals of Epidemiology 03/2014; 24(3):171-3 -
2014
March 3. Added new page for Judea Pearl at StatLit.org
-
2014
January 18. Added new page for Wayne
Winston at StatLit.org
-
2014: Jan 15-18.
2014 Joint
Mathematics Meeting, Baltimore, MD.
Note:
Paper titles never mention "confound", "confounds"
"confounding", "confounder", "cause" , "causes" or "causing."
Just one paper title mentions "causal": Mathematical Challenges
in Causal Inference ...."
WEDNESDAY: Assessing Quantitative Reasoning and Literacy,
organized by Semra Kilic-Bahi, Eric Gaze and Aaron Montgomery:
8:00 a.m.
Standardizing assessment across QL courses. Jill Bigley
Dunham and Betty Mayfield*, Hood College
8:20 a.m.
Three Approaches to Assessment in the Quantitative Reasoning
Classroom. Maura B. Mast*, University of Massachusetts
Boston
8:40 a.m.
Assessing Quantitative Reasoning in Introduction to Probability
and Statistics. Robert J. Krueger*, Concordia University,
St. Paul
9:00 a.m.
Collaborative approach to Assessing Q/L within Carnegie's
Quantway. Cinnamon Hillyard*, Eugene Milman and Duane Benson
9:20 a.m.
QL Across the Curriculum at Colby-Sawyer College. Semra
Kilic-Bahi*, Colby-Sawyer College
9:40 a.m.
Measuring Habits of Mind: Toward a Prompt-less Instrument for
Assessing Q/L. Stuart Boersma* and Dominic Klyve
10:00 a.m.
Results from an NSF TUES Quantitative Reasoning Assessment
Project. Eric Gaze*, Bowdoin College
10:20 a.m.
Assessment in an inquiry-based quantitative reasoning course for
business students. Victor I Piercey*, Ferris State
University
10:40 a.m.
The Need to Assess Quantitative Literacy in the Major.
Rodney E McNair*, Delaware State University
FRIDAY:
Data, Modeling, and
Computing in the Introductory Statistics Course, organized by
Zieffler, Alberts and Pruim
1:00 p.m.
Data Visualization Using Minitab, Google Fusion Tables, and
Tableau. Sue B Schou*, Idaho State University
1:20 p.m.
Visualizing the Central Limit Theorem through Simulation.
Eric Ruggieri*, College of the Holy Cross
1:40 p.m.
P-Values Through Simulation. Julie A. Belock*, Salem State
University
2:00 p.m.
Understanding P-values: Advantages & Challenges of
Randomization-Based Inference. Catherine Case, M. Battles,
T. Jacobbe
2:20 p.m.
Playing and Getting "Messy" with Data. Rodney X. Sturdivant*,
Shonda Kuiper, and Kevin Cummiskey
2:40 p.m.
Designing Simulated Experiments in the Introductory Statistics
Course. Shonda R Kuiper*, Grinnell College
3:00 p.m.
Using an Ever-Growing Data Set in an Introductory Statistics
Course. Sarah L. Mabrouk*, Framingham State University
3:20 p.m.
Big Data in the Intro Stats Class: Expose Students to a
Real-World, Complex Dataset. Nicholas J. Horton, B. Baumer,
H. Wickham
3:40 p.m.
Statistical Crowd Counting. Grant L Innerst*, Shippensburg
University Ben Galluzzo, Shippensburg University
4:00 p.m.
Using Genomics Data in Introduction to Probability and
Statistics. Kimberly A Roth*, Juniata College
4:20 p.m.
Predicting Drug Resistance: Probability and Statistics Meet the
Building Blocks of Proteins. Majid Masso*, George Mason
University
4:40 p.m.
Modeling -- It's harder than you might think. Patricia B
Humphrey*, Georgia Southern University
5:00 p.m.
Against All Odds: Inside Statistics. Marsha J. Davis*,
Eastern Connecticut State University
5:20 p.m.
Using Faculty Research as a Teaching Tool In Statistics.
Phong Le*, Niagara University
5:40 p.m.
A Semester Project for Introductory Statistics. Murray H.
Siegel*, Arizona State University
FRIDAY: Instructional Approaches to Increase Awareness of the
Societal Value of Mathematics
1:00 p.m. Graph clustering for the high school
classroom. Emilie Hogan* and Gabriela Radu
1:20 p.m. Using material from a standard college algebra course to
enhance students understanding of some social issues. A. S.
Elkhader
1:40 p.m. College Algebra or Economics of Being Green. Yevgeniy V.
Galperin*, East Stroudsburg University
2:00 p.m. A Service-Learning Approach to Mathematical Modeling. Olivia M.
Carducci*, East Stroudsburg University
2:20 p.m. Supporting Quantitative Literacy with Service-Learning: The
Pitfalls and the Promise. Victor I Piercey*, Ferris State
University
2:40 p.m. Using Service-Learning to Connect a Quantitative Literacy
Course to the Community. Andrew J Miller*, Belmont University
3:00 p.m. Building a capstone course on the theme of the relevance of
mathematics to society. Maritza M. Branker*, Niagara University
3:20 p.m. Math in the City: connecting classroom to community through
modeling. Alexandra Seceleanu*, Kathryn (Katie) Haymaker |
|
Citations as of 2013 |
|
Google Scholar
search for the phrase "statistical literacy": 3,790 entries excluding
patents and citations as of Dec., 2013.
For this list, select if "Statistical
Literacy" in Title.
Total number by Year of Publication: 1951 (1). 1979 (2). 1989
(1). 1992 (1). 1993 (1). 1995 (3). 1997 (3). 1998 (5). 1999 (4). 2000 (8).
2001 (3). 2002 (15). 2003 (13). 2004 (13). 2005 (12). 2006 (12). 2007 (6).
2008 (12). 2009 (3). 2010 (20). 2011 (6). 2012 (1). 2013 (1).
|
RANK |
"--------------------- CITATIONS ----------------------- |
|
2013 |
2013 |
2012 |
2011 |
Article/Book |
|
1 |
406 |
307 |
265 |
I. Gal (2002). Adults' statistical literacy:
Meanings, components, responsibilities. ISR |
|
2 |
165 |
131 |
106 |
K Walman (1993). Enhancing statistical
literacy: Enriching our society.
JASA |
|
3 |
142 |
123 |
100 |
J Watson, R Callingham (2003). Statistical
literacy: A complex hierarchical
construct. SERJ |
|
4 |
134 |
108 |
86 |
DJ Rumsey (2002). Statistical literacy
as a goal for introductory statistics courses. JSE |
|
5 |
105 |
56 |
56 |
D. Ben-Zvi (2004). Statistical literacy,
reasoning, and thinking: Goals, definitions, and challenges. |
|
6 |
98 |
80 |
66 |
D Ben-Zvi, et al. (2004). The challenge of developing
statistical literacy,
reasoning, and thinking. [book] |
|
7 |
65 |
51 |
36 |
I Gal (2005). Statistical literacy.
The Challenge of developing statistical literacy |
|
8 |
48 |
45 |
39 |
Watson & Moritz (2000). Development of understanding of
sampling for statistical literacy.
Jrnl Mathematical Behavior |
|
9 |
44 |
37 |
33 |
J Garfield et al, (2005). Research on
statistical literacy, reasoning, and
thinking.... The challenge … |
|
10 |
40 |
36 |
31 |
J Watson (2005). Developing reasoning about samples. The
challenge of developing statistical
literacy. |
|
11 |
36 |
32 |
30 |
S. Murray and I. Gal (2002). Preparing for diversity in
statistics literacy:
Institutional-educational implications |
|
12 |
31 |
30 |
27 |
I Gal (2003). Teaching for statistical
literacy and services of statistics
agencies. American Statistician |
|
13 |
30 |
25 |
23 |
I. Gal (2002). Statistical literacy:
Conceptual and instructional issues. Perspectives on adults
learning mathematics |
|
14 |
30 |
28 |
23 |
M. Schield (1999). Statistical literacy:
Thinking critically about statistics.
APDU: Of Significance |
|
15 |
29 |
28 |
24 |
M. Schield (2004). Statistical literacy
curriculum design. IASE Curriculum
Design Roundtable. |
|
16 |
28 |
|
15 |
M. Schield (2004). Information literacy,
statistical literacy and data
literacy. IASSIST |
|
17 |
28 |
25 |
22 |
R. Callingham, J. Watson (2005). Measuring
statistical literacy. Journal of
Applied Measurement |
|
18 |
24 |
23 |
22 |
I Gal (1995). Statistical Tools and
Statistical Literacy: The Case of the
Average. Teaching Statistics. |
|
19 |
24 |
|
|
I. Gal (2003). Expanding conceptions of
statistical literacy. SERJ |
|
20 |
24 |
|
|
M Schield (2006). Statistical Literacy:
Reading graphs and tables of rates and percentages |
|
21 |
24 |
|
14 |
M. Schield (2002). Statistical literacy survey analysis:
Reading tables and graphs of rates and percentages |
|
22 |
23 |
|
|
K. Bessant (1992). Instructional design and development of
statistical literacy. |
|
23 |
22 |
|
|
Hellems et al (2007). Statistical literacy
for readers of Pediatrics: a moving target |
|
24 |
22 |
|
|
M. Schield (2010). Assessing statistical
literacy: Take CARE. In Assessment
Methods… book. |
|
25 |
20 |
|
|
DG Haack (1979). Statistical literacy:
A Guide to Interpretation. Book. |
|
26 |
19 |
|
|
M. Schield (2000). Statistical literacy:
difficulties in describing and comparing rates and percentages |
|
27 |
18 |
|
|
Snell (1999). Using Chance media to promote
statistical literacy |
|
28 |
17 |
|
|
JM Watson (2004). Statistical literacy:
From idiosyncratic to critical thinking |
|
29 |
16 |
|
|
Anyama & Stevens (2003). Graph interpretation aspects of
statistical literacy:
A Japanese perspective |
|
30 |
15 |
|
|
J. Moreno (1998). Statistical literacy:
statistics long after school |
|
31 |
15 |
|
|
JL Moreno (2002). Toward a statistically
literate citizenry: What statistics
everyone should know |
|
32 |
15 |
|
|
M. Schield (2002). Three kinds of
statistical literacy: What should we
teach |
|
33 |
14 |
|
|
JM Watson (2003). Statistical literacy
at the school level: What should students know and do |
|
34 |
14 |
|
|
M. Schield (2004). Statistical Literacy
and liberal education at Augsburg College [citation] |
|
35 |
13 |
|
|
Lehola (2003). Promoting statistical
literacy: A South African perspective |
|
36 |
13 |
|
|
P. Cerrito (1999). Teaching statistical
literacy |
|
37 |
11 |
|
|
JM Watson (1995). Statistical literacy:
A link between mathematics and society |
|
38 |
10 |
|
|
Carmichael & Cunningham (2003). Factors Influencing … Students'
Interests in Statistical Literacy |
|
39 |
10 |
|
|
Gelman et al. (1998). Student projects on
statistical literacy and the media |
|
40 |
10 |
|
|
JM. Watson (1998). The role of statistical
literacy in decisions about risk:
Where to start |
|
41 |
10 |
|
|
Watson & Kelly (2000). The vocabulary of
statistical literacy |
|
42 |
9 |
|
|
Ridwgway et al. (2008). Mapping New Statistical Iliteracies and
Literacies |
|
43 |
8 |
|
|
M. Schield (1998). Statistical literacy
and evidential statistics |
|
44 |
8 |
|
|
Monahan (2007). Statistical Literacy
A Prerequisite for Evidence-Based Medicine |
|
45 |
8 |
|
|
Watson & Nathan (2010). Assessing the interpretation of
two-way tables as part of statistical literacy |
|
46 |
7 |
|
|
D. Trewin (2005). Improving statistical
literacy: The … roles of schools and
the National Statistical Offices |
|
47 |
7 |
|
|
DJ Rumsey (2002). Statistical literacy:
Implications for teaching, research, and practice |
|
48 |
7 |
|
|
Kurtz et al. (2008). Using models and representations in
statistical contexts:....sub-competency of statistical literacy |
|
49 |
7 |
|
|
M. Schield (2000). Statistical literacy
and mathematical reasoning |
|
50 |
7 |
|
|
R. delMas (2002). Statistical literacy,
reasoning, and thinking: A commentary |
|
|
LIFETIME STATLIT.ORG STATISTICS AS OF
12/2014 |
|
Lifetime page views (Only those
with over 10,000 page views).
-
221,442: Index or Home page (2003-) -
38,935: Standardizing (2006-) -
31,171: Joel Best (2006-) -
25,881: Articles/Papers (2006-) -
24,162: Adult Numeracy (2008-)-
21,030: Howard Wainer (2007-) -
16,708: StatLit News 2008
(2009-) -
16,311: StatLit News 2009
(2008-) -
15,156: StatLit News 2007
(2007-) -
12,729: StatLit News 2005
(2006-2008) -
11,388: StatLit News 2010
(2011-) |
StatLit.org has had more than a 1.7
million downloads, 1.4 million visits and 930,000 page views between
2005 and 2014.
Lifetime paper downloads (Only
those with over 10,000 downloads)
-
100,052:
M. Schield (2006)
Percentage
Graphs in USA Today
-
17,907: M. Schield (2006)
Presenting Confounding Graphically
-
10,933: Jane Miller (2009)
Interpreting ...
regression coefficients
-
10,038: M. Schield (2011)
Stat Lit: New Mission for Data Producers
|
|
TOP EXCEL & AUDIO
DOWNLOADS in 2014 |
|
EXCEL WORKSHEET DEMOS. All by
Milo Schield (2014 downloads)
-
Create lognormal in Excel 2013.
(36,618+585)
Slides
Demo -
Model Logistic Regression using Excel
2013 (6,472+806)
6up
1up -
Using the Z-test function in Excel
2008 (6,117)
6up
1up -
COUNTIF histograms: Excel 2013
(3278+730)
6up
1up
demo
-
Confidence intervals with Excel 2010
(2044+1861)
6up
1up -
T-Test command with Excel 2013
(294+2,283) 6up
1up -
Trendline 2Y1X with different scales.
(641+1834)
6up
1up
-
Create Pivot Tables using Excel 2008 (566+1334)
6up 1up
-
Using the T-Test function in Excel 2008 (1563+). 6up 1up -
Regress using Data Analysis in Excel 2013
(508+) 6up 1up
-
Create lognormal distribution with Excel
2008. (466) 6up -
Model using Linear Trendline in Excel
2013. (273+) 6up 1up |
AUDIO CHAPTER OVERVIEWS.
All by Milo Schield (2014 downloads)
Reviews of chapters in Schield's Statistical
Literacy textbook.
-
StatLlit Text Ch 4 Overview
6up
1up
Audio (1998).-
StatLlit Text Ch 3 Overview
6up
1up
Audio (465).
-
StatLlit Text Ch 6 Overview
6up
1up Audio
(336).
-
StatLlit Text Ch 5 Overview
6up
1up Audio
(307).
DeepMetrix tracks the top 25 files downloaded each month from
StatLit.org. Very few files appear in the top 25 all 12 months.
The number of months tracked is in brackets [#] if less than 12.
Excludes papers having fewer than 300 downloads. Excludes non-articles
such as Amazon lists, reference documents (QR and statistical textbooks)
and non-statistical articles (Freeminds). Unlike
previous years, it includes PowerPoint slides and selected reference
documents (UTSA-QEP-quantitativeScholarship-Final.pdf) and pdf-scans
(1993 Weinberg).
|
|
TOP
PAGES VIEWED in 2014* |
Top Pages Viewed at
www.StatLit.org in 2014
(####; ####; ###; ###): page views 2014, 2013;...2010; 2009; 2008.
-
Index (50,347; 47,674; 29,554; 28,157, 23,159; 15,729; 10,423)-
Standardizing (6711; 9809; 6633; 5176; 3265; 2434; 1718)
-
StatLit
News 2013
(4,099) -
StatLit
News 2012
(3539; 2891; 1297[7]) -
Joel Best
(3530; 3451; 4617; 5036; 4794; 3481; 3118): Author
-
StatLit Papers
(3175; 2914; 3073; 4203; 3131; 2837; 2444)
-
StatLit News 2009
(3148; 2269; 2797; 3228; 4869)
-
StatLit News 2010
(2896; 2836; 2693; 2963)
-
Q/L Textbooks
(2687*; 1868*; 2233; 3159; 2741; 2484; 2387)
-
StatLit News 2011
(2596; 2562; 3023)
-
Howard Wainer (2574; 3396;
4296; 3893; 2778; 2127; 1966) -
StatLit News 2008 (2567; 2501; 2698; 2975;
3333; 2634)
-
Adult Numeracy (2489; 2784; 4070; 4998, 5007; 2467; 1987)
-
Tools (2039[10]) -
StatLit News 2007
1584*; 1527*; 1940; 2127;
2552; 1498; 1928 -
Blastland (1818*; 1331* [9]) Author of "The
Tiger that Isn't" -
Q/L Activities
QL2
(1605*; 1886; 2106; 1725*; 1278; 1378)
-
Gerd
Gigerenzer (1586*; 1713*; 2283; 2567; 1993*; 1415; 1503) -
Q/L Books QLit
(1522*; 1884; 2305; 1418; 1459) No textbooks -
Jane Miller (1808*)
Chicago Guides -
Wayne Winston
(1105*) Textbook author: Excel Statistics -
Gerald
Bracey (897*; 1487; 1923; 2374; 2655; 2669; 2,035)
Total 2013 page views (including /GC):
153,099 -- a 19% increase. |
[Left side is OK for 2014; Right side not
updated]
Page views as a percentage of Total:
Index (31%),
Standardizing (6%),
Joel Best (2%),
Howard Wainer (2%),
StatLit Papers (1.9%) and Adult numeracy
(1.8%). All the rest were less
that 1.9% except "Other" (29%).
Six new pages in 2013:
Uri Bram, Conrad Carlburg,
Kaiser Fung, David Moore, StatLit2013 and
Video1.
Note: Website statistics are tabulated by
the DeepMatrix program LiveStats® .XSP V8.03. Each month, the views
for the top 25 website pages are tabulated. Those pages that
aren't in the top 25 that month are treated as having zero views.
* Pages with less than 12 months
statistics are indicated by the asterisk (no adjustment). Pages with
less than 6 months of statistics are omitted (except those that are
student assigned during certain months).
In 2013, the StatLit web site has 69 htm pages in the main directory. Others include student-assigned pages (/GC) and the
Keck Survey.
Navigation page views (2013; 2012; 2011; 2010;
2009; 2008) totaled (13,327; 10,203; 11,180; 9,716; 9,522; 8,474): Statistical
Literacy (2,482; 2,616; 3,046; 2,729; 2,396; 2,100),
Statistical
Reasoning (3,829; 2,081; 2,051; 1,617*; 1,625; 1,425),
StatLit News
(2,087; 1,980*; 2,162; 1,836;
1,928; 1,863), Authors (1,715*; 1,578*;
2,245; 1,980; 2,033; 1,860), Numeracy (1,937*; 1,533*; 1,676*; 1,554*; 1,540; 1,226)
and 2Authors2 (1277*; 415*[3]).
Student-assigned page-views
[*.xls and /GC] were not totaled.
|
|